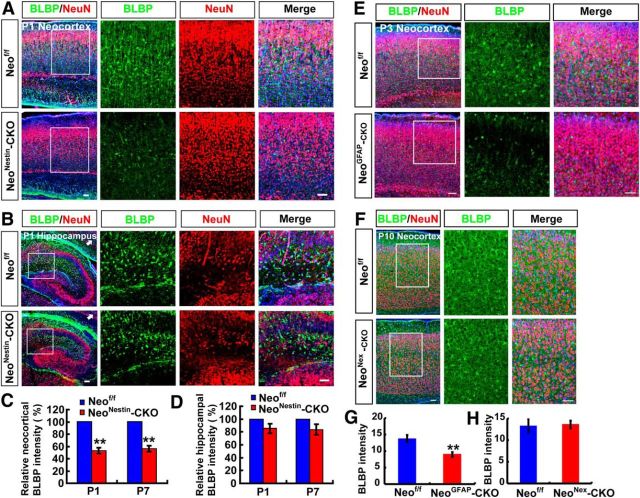
Figure 7.
Reduced neocortical astrogliogenesis in neonestin-CKO and neoGFAP-CKO, but not neoNex-CKO, mice. A, B, Double immunostaining of BLBP (green) and NeuN (red) in neocortex (A) and hippocampus (B) of P1 neof/f and neonestin-CKO mice (sagittal sections). C, D, Quantitative analysis of relative BLBP fluorescent intensity (C, n = 6 for neocortex per group; D, n = 6 for hippocampus per group, normalized WT control) in P1 and P7 neof/f and neonestin-CKO mice. E, F, Double immunostaining of BLBP (green) and NeuN (red) in neocortex of P3 neof/f and neoGFAP-CKO mice (E), and in neocortex of P10 neof/f and neoNex-CKO mice (F) (sagittal sections). G, H, Quantitative analysis of BLBP fluorescent intensity (n = 6 per group) in P3 neof/f and neoGFAP-CKO mice (G) and BLBP fluorescent intensity (n = 6 per group) in P10 neof/f and neoNex-CKO mice (H). Scale bars, 20 μm. Data are mean ± SEM. **p < 0.01, compared with control group (Student's t test).

