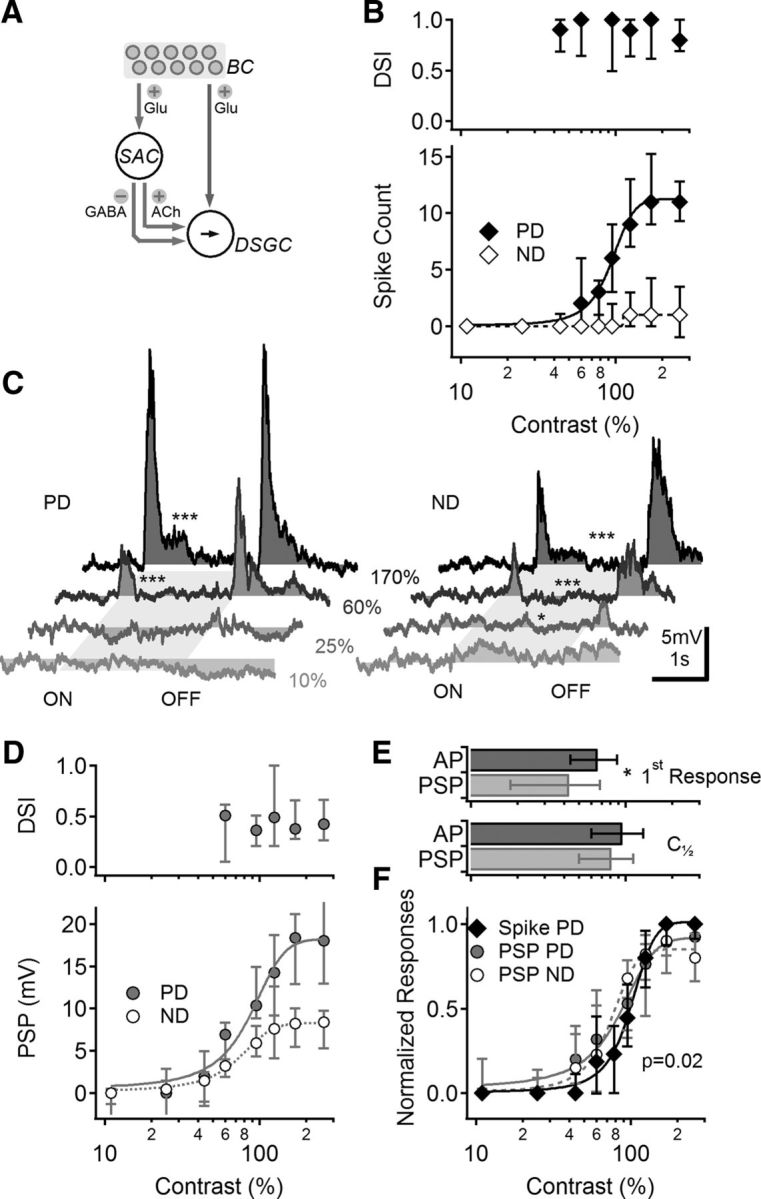
Figure 1.

Contrast sensitivity of visual responses in DSGCs. A, Schematic representation of the main components of the retinal DS network. Photoreceptors (data not shown) transduce light stimuli and signal to BCs. BCs activate two pathways: one is a direct connection to DSGCs (right), and another goes via intermediate amacrine cells (left), most notably SACs. SACs then provide directionally tuned inhibition and excitation to DSGCs, forming a FF circuit. B, Median (±quartiles) calculated DSI (top) and spike count for the preferred and null directions (PD, ND; bottom) in DSGCs at different stimulus contrasts (n = 43). C, Representative PSPs evoked by PD (left) and ND (right) stimuli, shade-coded for different contrast levels. The stimulus consisted of a moving bar; the approximate time interval over which the stimulus occupied the cell's receptive is indicated in gray. Asterisks indicate comparison between PSPs and baseline (*p < 0.05, ***p < 0.001, t test). D, Median (±quartiles) calculated DSI values (top) and PSP amplitudes (bottom) for different contrasts, as in B. n = 16. E, Top, Mean (±SD) lowest contrast level that elicited a measurable signal in DSGCs, for suprathreshold (black) and subthreshold (gray) responses (*p = 0.005, t test). Bottom, The contrast level that elicited a half-maximal response was similar between spike (suprathreshold) and PSP (subthreshold) responses. F, Normalized contrast sensitivity curves (median ± quartiles) of the suprathreshold (black) and subthreshold (gray) responses. PSP contrast tuning was similar between PD and ND. For clarity, only PD suprathreshold responses are shown.
