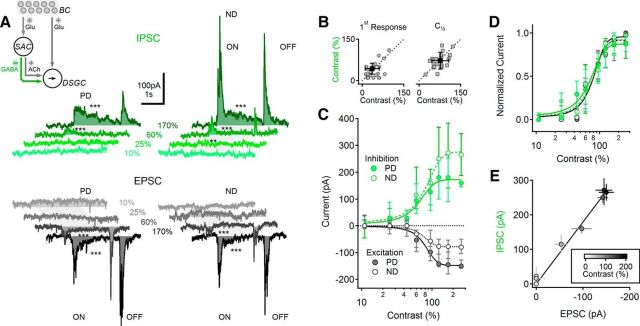
Figure 2.
Excitatory and inhibitory inputs to DSGCs exhibit balanced contrast sensitivity. A, Representative IPSCs (top; green) and EPSCs (bottom; black) in DSGCs in response to PD (left) and ND (right) stimulation at different contrast levels. Gray shaded areas indicate the approximate time interval over which the moving bar occupied the receptive field of the cell. Asterisks indicate comparison between PSCs and baseline (**p < 0.01, ***p < 0.001, t test). Inset, Schematic showing the primary excitatory and inhibitory inputs to the DSGC. B, Contrast levels that elicited the first observable synaptic current (left) and half-maximal response (right) were similar between inhibitory and excitatory currents (n = 25, individual experiments in gray, population mean ± SD; black). C, Median (± quartile) contrast tuning of EPSCs (black) and IPSCs (green). PD, solid lines; ND, dotted lines. D, Median (± quartile) normalized contrast sensitivity curves were similar between PD and ND responses and between EPSCs and IPSCs (same color scheme as in C). E, EPSC and IPSC amplitudes for each contrast level (mean ± SEM) remained proportional over the entire range of contrast stimuli tested (r = 0.94). Responses are grayscale coded based on contrast level (inset).

