Figure 5.

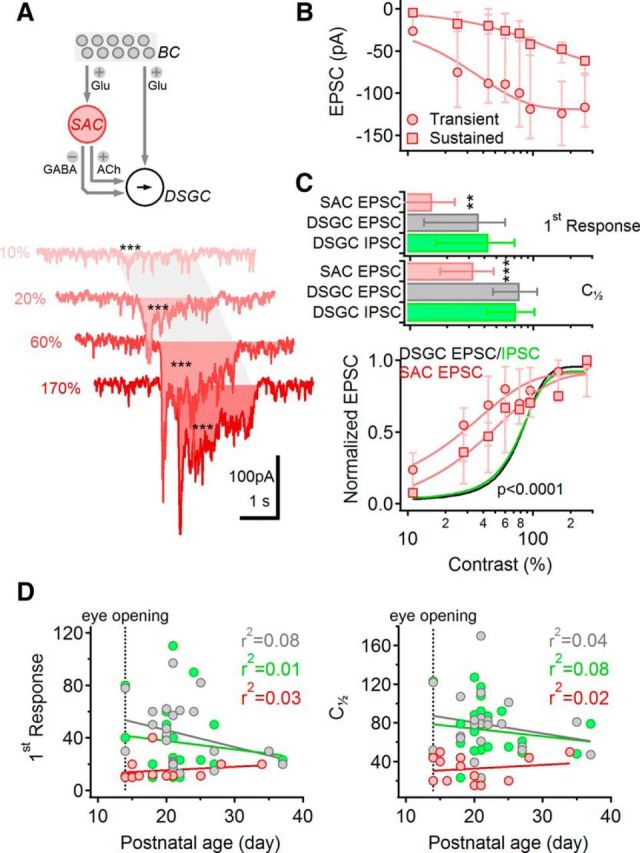
Excitatory input to SACs exhibits high contrast sensitivity. A, Top, Schematic highlighting SACs in the DS network. Bottom, EPSCs from a representative SAC in response to moving bar stimulation, color-coded according to the contrast level. The shaded area indicates the approximate time interval over which the stimulus occupied the receptive field of the cell. Asterisks indicate comparison between stimulus response and baseline (***p < 0.001). Note that EPSCs were evident at the lowest contrast level tested. B, Median (±quartile) amplitudes of the sustained (squares) and the transient (circles) components of the EPSC evoked by different contrast levels (n = 13 cells). C, Top, Lowest detectable (mean ± SD; top) and half-maximal (bottom) contrast levels were significantly lower for SAC EPSCs (measured at the peak; red) compared with either EPSCs (gray) or IPSCs (green) recorded in DSGCs; **p < 0.01; ***p < 0.001 (one-way ANOVA). Bottom, Data from (B) normalized by the largest response in each cell (red). The contrast tuning of the sustained SAC-EPSC was significantly different from that of the transient SAC response (p < 0.00001, two-way ANOVA). Normalized contrast tuning curves of DSGC EPSCs (black) and IPSCs (green) are shown for comparison. D, Contrast sensitivity [measured as first observable response (left) and half-maximal contrast levels (right)] was not correlated with postnatal age. Color coding as in C. Responses were fitted with a linear regression.
