Figure 7.
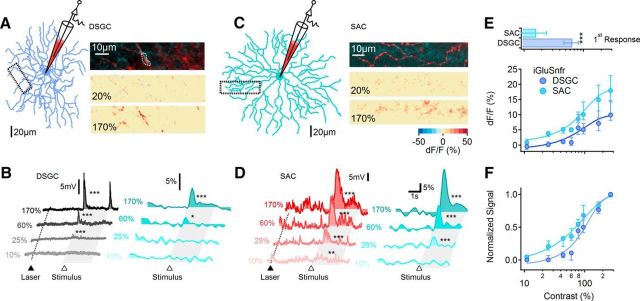
Glutamatergic inputs to SACs and DSGCs exhibit distinct contrast sensitivity. A, DSGCs were patched and filled with AlexaFluor-647 for electrical recordings and morphological reconstruction. The morphology of the DSGC (left) from which voltage and iGluSnFR signals shown in B were recorded. Right, Top, Magnified view of DSGC dendrite (red) from the dotted box in A overlaid with the mean iGluSnFR background fluorescence (teal). Middle and Bottom, Heat map of the peak change in iGluSnFR signals for two contrast levels during stimulation with a moving bar. B, Representative somatic PSPs (left) and the corresponding dendritic iGluSnFR transients (right) from the DSGC in A. The dotted line and a filled triangle mark the beginning of 2P laser scanning. The open triangle and the shaded area indicate the approximate time interval over which the stimulus entered and occupied the cell's receptive field. C, D, Similar to A and B for a SAC. E, Top, Lowest contrast that evoked detectable EPSCs and iGluSnFR signals (mean ± SD) were significantly lower in SACs (n = 11 cells) compared with DSGCs (p = 0.00001, n = 8 cells, t test). Within each cell type, the somatic voltage responses and iGluSnFR fluorescence exhibited similar contrast activation thresholds. Bottom, Contrast sensitivity of the median (±quartile) iGluSnFR signal in DSGC and SAC dendrites. F, The data in E (bottom) normalized to the largest response in each cell. Error bars indicate first and third quartiles.

