Figure 8.

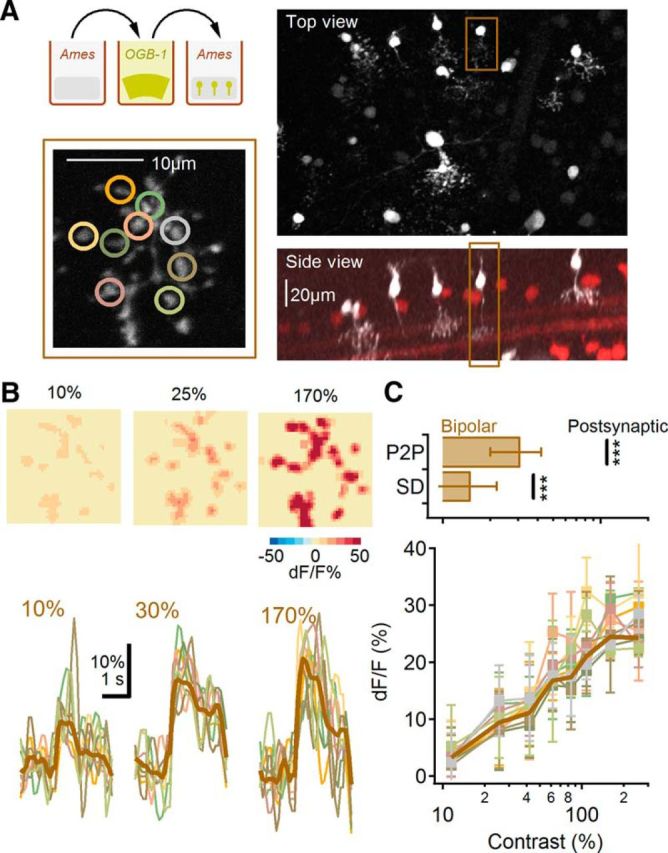
Similar contrast sensitivity in different axonal boutons of a single BC. A, Experimental protocol. ON BCs were filled with OGB-1 in whole-mount retina with a newly developed method of labeling multiple neural types by gentle bending of the retinal tissue in a concentrated indicator solution (top, left). Right, Top (top) and side (bottom) views of brightly and sparsely labeled ON-BCs. Brown frame marks the ON-BC chosen for axon terminal recording (bottom, left; B). B, Representative calcium transients from individual terminals (bottom; color-coded to match the locations in A, bottom, left) and the spatial distribution of the peak dF/F levels (top) for three contrast levels. Thick brown line indicates the average response of the entire axonal field-of-view. Responses were elicited by the same moving bar stimulus used elsewhere. C, Top, The range of contrast sensitivity in different axonal boutons from individual cells quantified as P2P or SD of the half-maximal response was significantly smaller than the differences between SAC and DSGC responses (black lines; ***p < 0.001, t test). Bottom, Fluorescence signals (mean ± SD) from all the recorded axon boutons color coded as in B, bottom.
