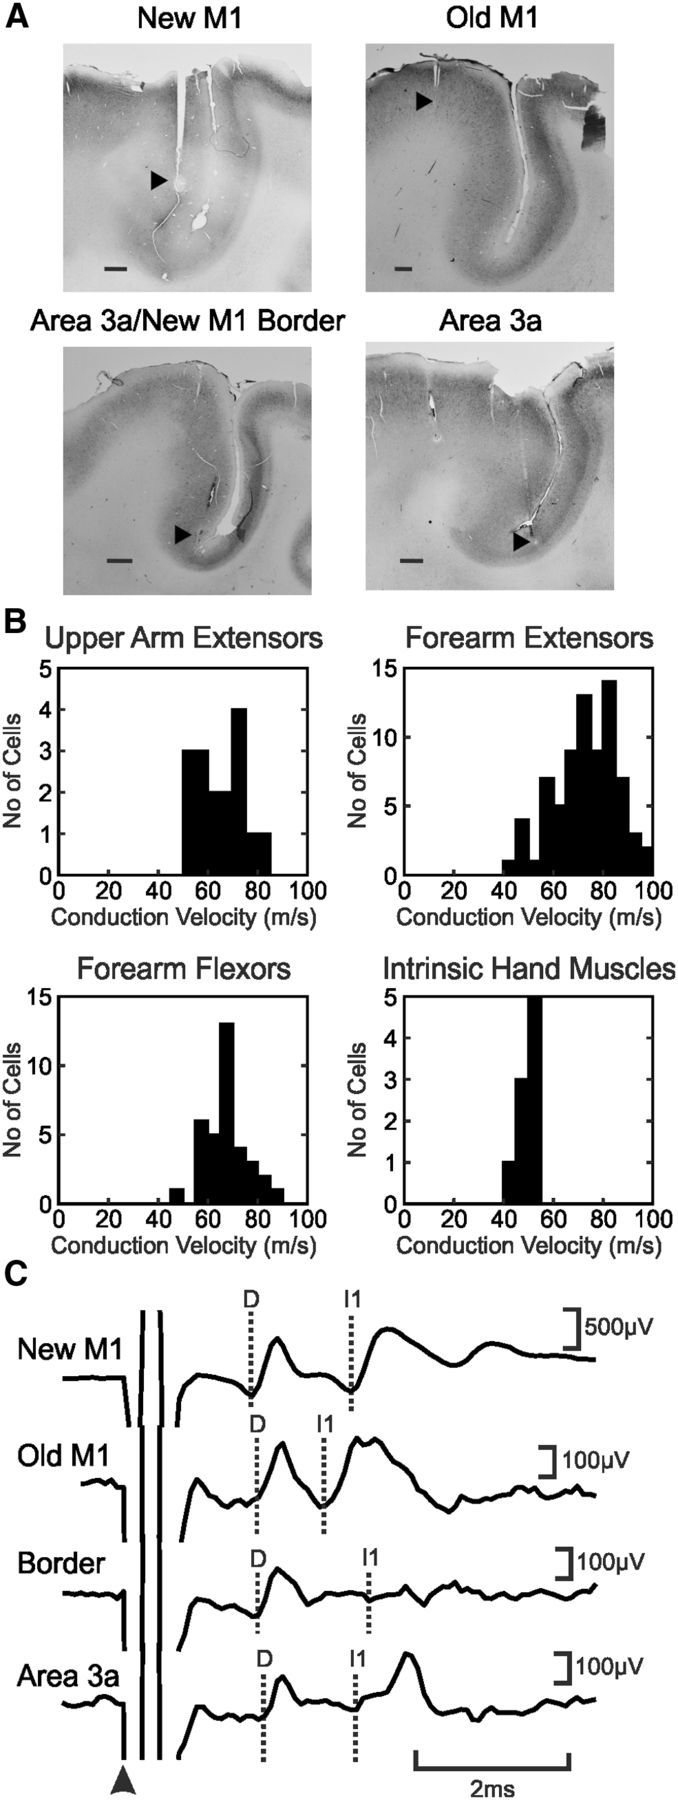
Figure 1.

Methodology. A, Histological confirmation of the location of four cortical electrodes, each in a different animal. Black arrowheads indicate sites of electrolytic lesion. Scale bars, 1 mm. B, Histograms of conduction velocities for motoneurons recorded from the six monkeys for each of the four muscle groups. C, Average cord dorsum potentials to stimulation of electrodes shown in A (single shock at 300 μA). The arrowhead indicates the stimulation time; dotted lines show the D and I waves.
