Figure 6.
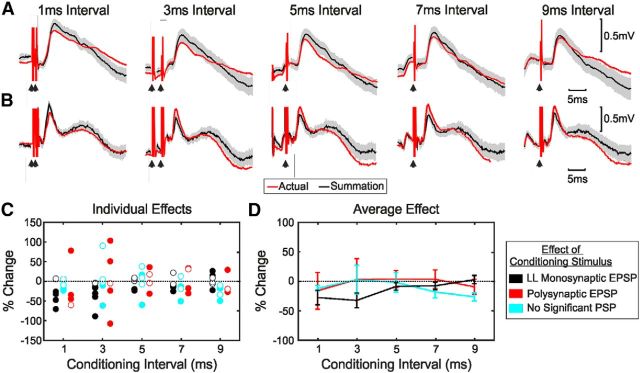
Effect of conditioning of new M1 stimulus by other cortical stimuli on EPSP amplitude. A, Average EPSPs in response to new M1 stimulation conditioned by old M1 stimulation at five different intervals, showing suppression of the EPSP. The average response to the conditioned stimulus is shown in red together with the expected response from summation of the responses to the test stimulus alone and the conditioning stimulus alone (black). The shaded area represents 95% confidence intervals on expected response. B, As in A, but for a different motoneuron. Shown are the average EPSPs in response to new M1 stimulation conditioned by area 3a stimulation, showing facilitation of the EPSP. C, Conditioned EPSP amplitude as a percentage of the expected EPSP amplitude from summation for all conditioning intervals. Filled circles indicate responses significantly different from expected. D, Average percentage response change as a function of the interstimulus interval. Error bars show SEM. Results in C and D have been averaged across cortical areas. LL, Long latency.

