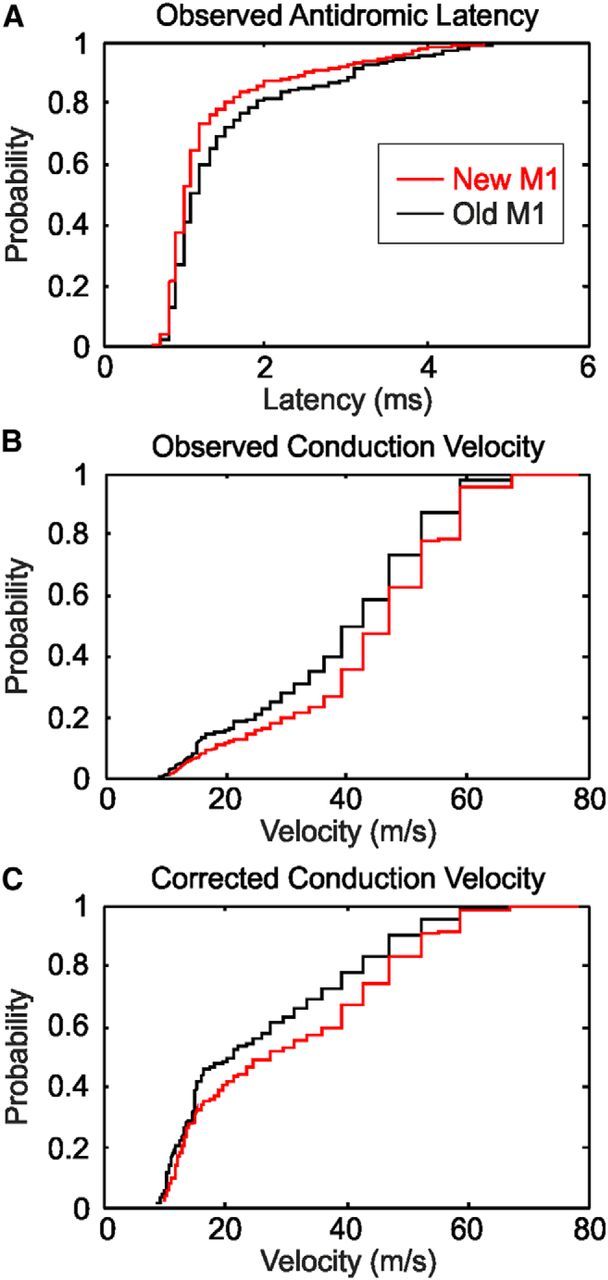
Figure 7.

Comparison of the properties of PTNs in new M1 and old M1. A, Cumulative probability plot of the antidromic latency after stimulation at the medullary pyramid. B, Cumulative probability plot of the conduction velocity, estimated from A using a conduction distance of 47 mm. C, as in B, but corrected for the sampling bias of extracellular recordings toward large neurons as described in the text.
