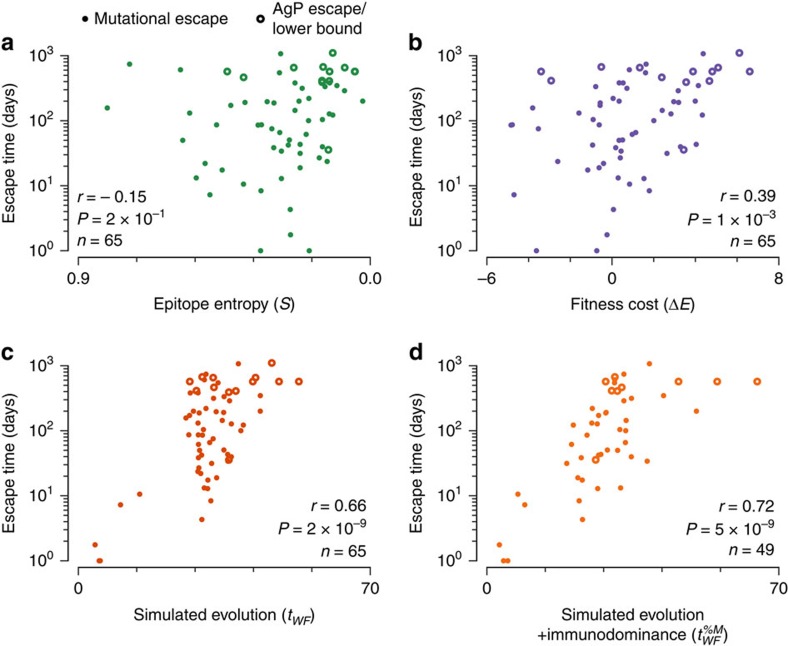
Figure 2. Measured escape times are strongly correlated with the simulated escape time.
Compared with the epitope entropy (a) and the average fitness cost of escape mutations (b), the time to escape in evolutionary simulation (c) shows more robust correlation with the escape time inferred from clinical data. When escape occurred through AgP mutations affecting presentation of the epitope (open circles), the time at which AgP mutants dominate the population is substituted as a lower bound for the escape time (n=3 cases). Similarly, the final time at which sequence samples were collected was substituted as a lower bound on the escape time when no escape was observed (n=10). (d) Information about immunodominance can be incorporated into evolutionary simulations, improving the predicted escape times for epitopes where this information is available (n=49). In all cases, epitopes where escape was observed at the time when T-cell response was detected are excluded (n=6 total, out of which 4 have immunodominance measurements). Epitopes studied include those derived from all HIV proteins except Vpu (because no patients targeted epitopes in Vpu early in infection) and gp120.

