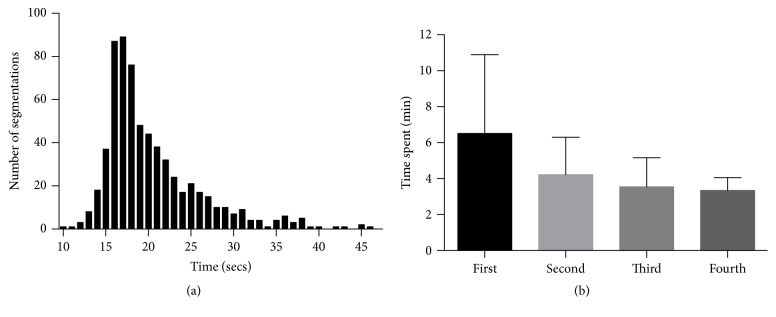
Figure 2.
Temporal data of segmentations. Panel (a) shows a histogram of the time spent for each segmentation line. Average was 20.40 seconds with a range of 10.01 to 46.22 seconds. Panel (b) shows the decreasing trend in total time spent in minutes segmenting one SD-OCT image in a subset of users who segmented 4 or more times (7 out of 22 users). Error bars are standard deviation.

