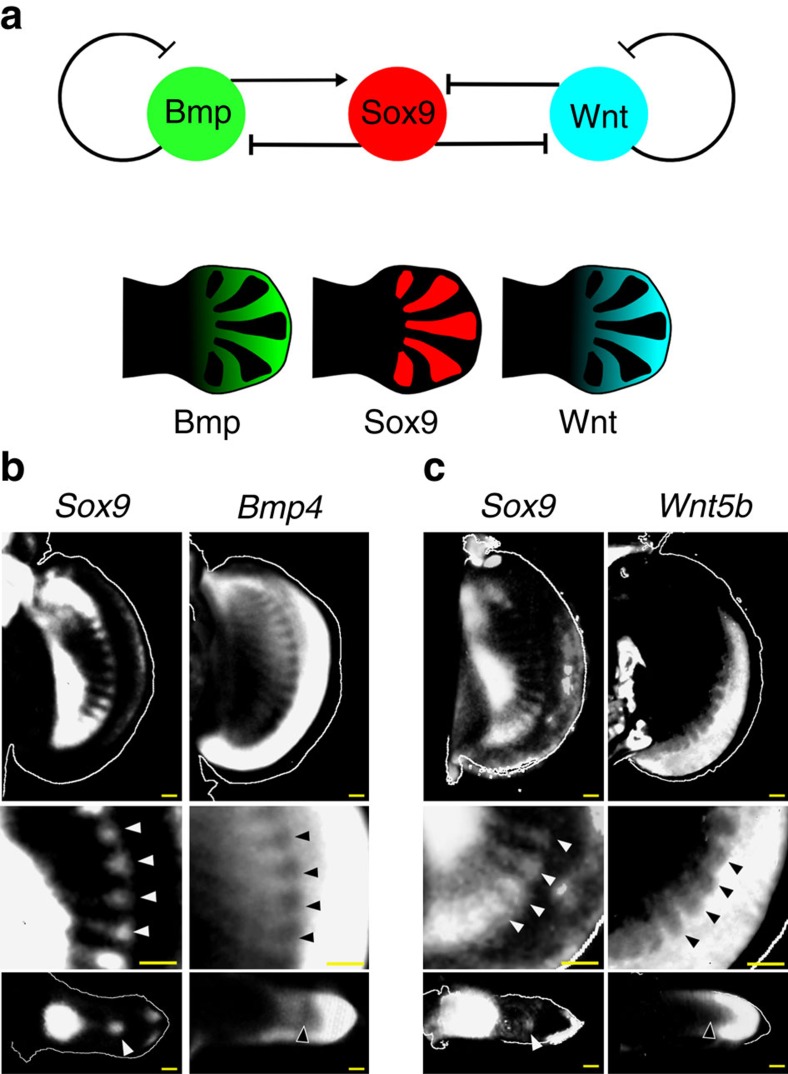
Figure 2. Out-of-phase expression patterns of Bmp and Wnt with Sox9.
(a) The generic Turing network in mouse digit patterning, and distribution of Bmp expression (green), Sox9 expression (red) and Wnt signalling activity (blue). (b) Top row, OPT scans of gene expression patterns in the left and right pectoral fin buds of the same S. canicula embryo (stage 30). The Sox9 image has been horizontally flipped to aid comparison of the two expression patterns. The middle panels (below) show magnified views of the top panels, highlighting with arrowheads the spots of Sox9 expression and the corresponding gaps in the Bmp4 expression. The lower panels show perpendicular virtual sections of the same two fin buds (‘transverse' sections) revealing that both the Sox9 spot and the Bmp4 gap, are in the centre of the bud, matching the situation in the mouse. Dorsal is to the top. (c) The same analysis as (b) for the Wnt5b gene. Scale bars, 100 μm.

