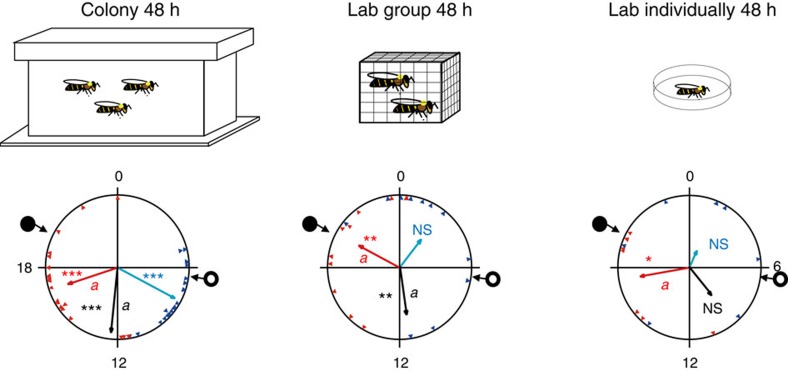
Figure 3. Social interactions with 30 bees produce weaker synchronization than the hive environment.
Representative circular statistics for callow bees from colony H6. ‘Lab group 48 h'—young bees that experienced their first 48 h in a cage with 30 other same-age bees before being monitored individually in constant laboratory conditions. The open and filled circles on the perimeter delineate the time of sunrise and sunset, respectively. The blue and red triangles depict the onset and offset for individual bees, respectively. The blue, black and red vectors (arrows) pointing from the centre towards the perimeter show the average time for the onset, median and offset, respectively. Vector length corresponds to the extent of phase coherence. Asterisks in matching colours correspond to the P-value obtained from a Rayleigh test for phase coherence (*0.01<P<0.05, **0.001<P<0.01 and ***P<0.001). The median for each bee (points for individual bees are not shown) was calculated as the midpoint between the onset and offset. Vectors sharing the same colour across different plots, and which are marked with different small letters, are significantly different in a Watson-Williams F-test with Bonferroni post-hoc tests across experimental groups. Sample sizes are 21, 11 and 7 for ‘Colony 48 h', ‘Lab group 48 h' and ‘Lab individually 48 h', respectively. The cartoons at the top summarize the social conditions experienced by the bees before transferring to locomotor activity monitoring cages in the laboratory.

