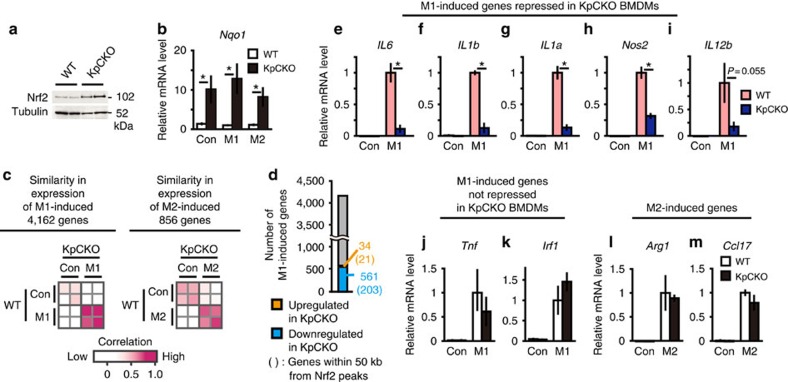
Figure 1. Genetic activation of Nrf2 inhibits M1 induction of proinflammatory cytokine genes.
(a) Nrf2 protein expression in BMDMs from two independent WT and KpCKO mice, respectively. (b) Relative Nqo1 gene expression. BMDMs from WT and KpCKO mice were either untreated (Con) or treated with M1 stimulation (M1, 5-ng ml−1 LPS and 10-ng ml−1 IFNγ) or M2 stimulation (M2, 10-ng ml−1 IL-4) for 6 h. (c) Similarity in gene expression of M1- and M2-induced genes between WT and KpCKO mice. With >2-fold change, 4,162 genes are upregulated by M1 stimulation (M1-induced genes), while 856 genes are upregulated by M2 stimulation (M2-induced genes), both in two independent WT mice. The expression pattern of M1- and M2-induced genes in WT and KpCKO BMDMs are compared to each other. The Pearson correlation coefficient for each comparison is depicted as colours from white (low) to magenta (high). (d) The number of M1-induced genes regulated by Nrf2. In 4,162 M1-induced genes, the number of genes upregulated or downregulated by Keap1-deficiency (with >2-fold change in KpCKO compared with WT in two independent BMDM cultures) are represented as orange and blue numbers, respectively. The numbers given in parentheses are the numbers of genes within 50 kb from Nrf2 peaks detected in the ChIP-seq analysis of M1-activated KpCKO BMDMs described below. (e–m) Relative expression of M1- and M2-induced genes in WT and KpCKO BMDMs. Expression of IL6 (e), IL1b (f), IL1a (g), Nos2 (h), IL12b (i), Tnf (j), Irf1 (k), Arg1 (l) and Ccl17 (m) are presented. Data in b,e–m are mean±s.d. from three to four mice (*P<0.05, unpaired t-test).

