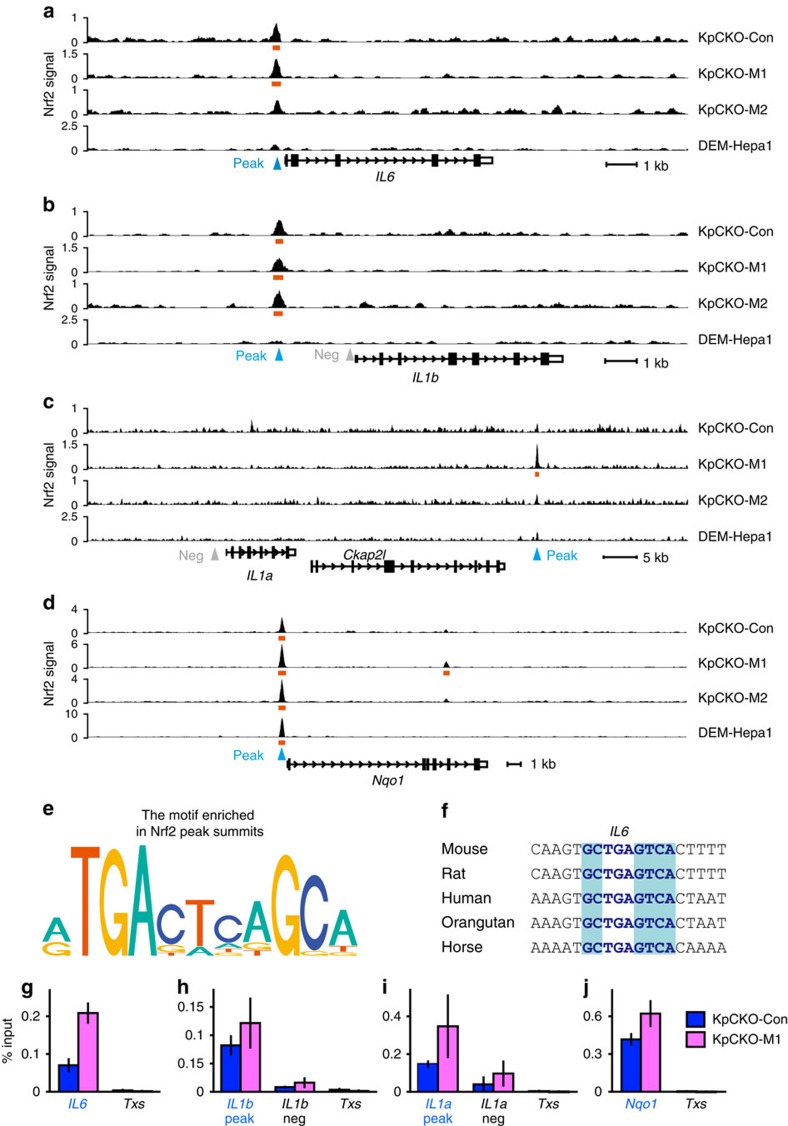
Figure 2. Nrf2 binding to the proximity of the proinflammatory cytokine genes.
(a–d) Nrf2 ChIP-sequencing tracks of KpCKO BMDMs and DEM-treated Hepa1 cells. KpCKO BMDMs were either untreated (KpCKO-Con) or treated with M1 stimulation (KpCKO-M1, 5-ng ml−1 LPS and 10-ng ml−1 IFNγ) or M2 stimulation (KpCKO-M2, 10-ng ml−1 IL-4) for 4 h. Fragment pileup per million reads at the genomic loci proximal to the IL6 (a), IL1b (b), IL1a (c) and Nqo1 (d) genes are presented. DEM-Hapa1 shows the Nrf2 ChIP-seq track of DEM-treated Hepa1 cells22. Orange bars represent the peak regions. Primers for ChIP-qPCR described below were designed to amplify peak and non-peak (negative control) regions indicated by blue and grey triangles, respectively. (e) A consensus motif enriched in a ±25 bp region from Nrf2 peak summits in KpCKO-Con samples. (f) Phylogenetic conservation of ARE motifs in peak regions proximal to the IL6. Nucleotides identical to the core sequence of ARE, TGAG/CnnnGC, are in blue shades, and nucleotides in ARE identical to the murine sequences are depicted with the blue characters. (g–j) Nrf2 ChIP-qPCR analyses of KpCKO BMDMs. The Nrf2 signal was detected at the peak regions proximal to IL6 (g), IL1b (h) and IL1a (i) genes (blue characters), similarly to the Nqo1 promoter (j) used as a positive control. The intron of the Txs gene (Txs, g–j) and the non-peak regions proximal to the IL1b (h) and IL1a (i) genes were used as negative controls. Data in g–j are mean±s.d. from three mice (*P<0.05, unpaired t-test).

