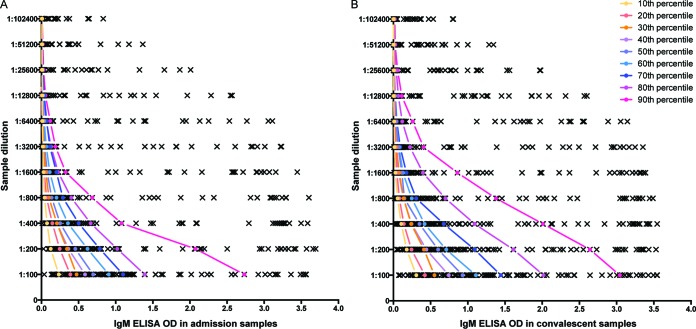
FIG 2.
Distribution of IgM ELISA ODs in admission samples (A) and convalescent/discharge samples (B) at sample dilutions from 1:100 to 1:102,400. The colored lines show the positions of the patients who had the OD at the 10th, 20th, and every 10th percentile up to the 90th percentile at a sample dilution of 1:100.

