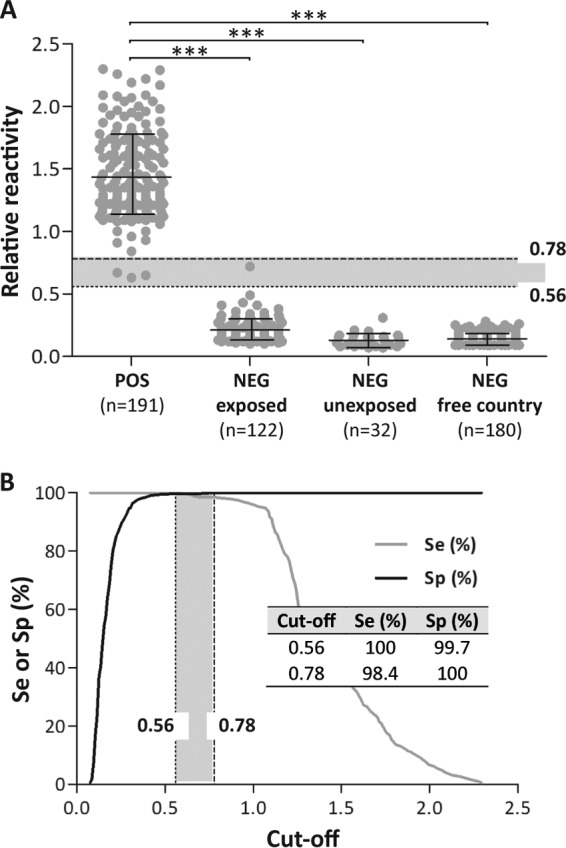
FIG 2.

Dot plot and ROC analysis of glyco-iELISA results. (A) Dot plot analysis. Serum samples obtained from positive (POS) and negative (NEG) animals were tested by glyco-iELISA as indicated in Materials and Methods. The POS group included serum samples obtained from culture-positive and serologically positive (by at least two different serological tests) animals. The NEG group included samples obtained from animals coming from herds with a history of brucellosis (NEG exposed); herds without any history of the disease (NEG unexposed); and herds from Canada, a brucellosis-free country (NEG free country). The mean and standard deviation for each group are indicated: POS, 1.43 ± 0.33; NEG exposed, 0.21 ± 0.09; NEG unexposed, 0.13 ± 0.05; NEG free country, 0.14 ± 0.04. ***, P < 0.0001; Mann-Whitney test. (B) TG-ROC plot of the results. ROC analysis was carried out using as a positive reference samples the sera of the POS group and as a negative reference samples of the sera of the three NEG groups described for the dot plot in panel A. The dotted and dashed lines in the dot plot and TG-ROC plots indicate the cutoff values for which maximal diagnostic Se or Sp, respectively, were achieved. The two cutoff values represent the bounds of an intermediate range (IR) of reactivity values (shaded areas). (Inset) Se and Sp values obtained for the two cutoff values. The cutoff value that concurrently optimizes Se and Sp coincides with the cutoff value for which maximal Se was achieved (0.56; dotted line).
