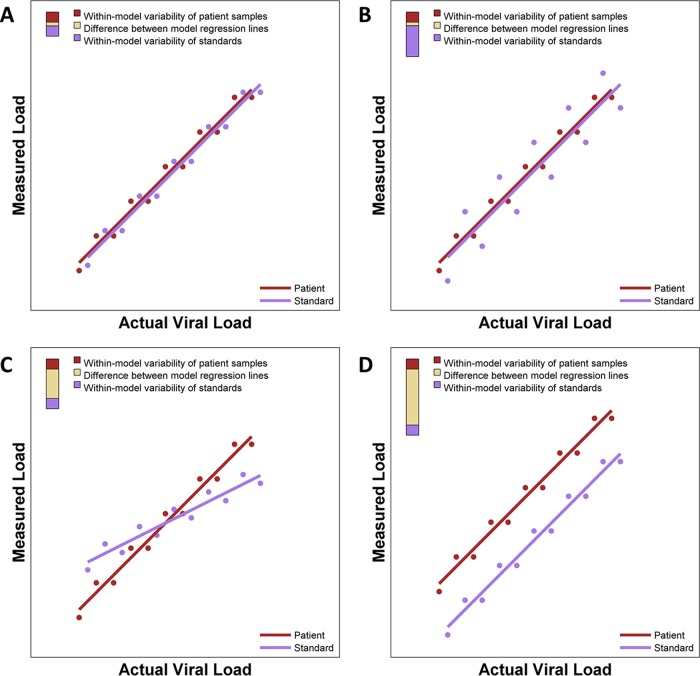
FIG 1.
Idealized illustration of DFI plots showing differing types of assay performance. Each panel shows regression models of both patient samples and standards. To the right of each regression model, a three-color bar graphically depicts contributions to the deviation from the ideal. The total height of the bar is the DFI. The proportions of the DFI attributable to within-model variability of patient samples, within-model variability of standards, and the difference between model regression lines are shown. (A) Nearly ideal case with almost identical regression lines that each have minimal variability, giving a small DFI. (B) Two nearly identical regression lines but with one line having extensive variability and the other having minimal variability. (C) Two very skewed regression lines. (D) Two parallel regression lines with distinct intercepts.

