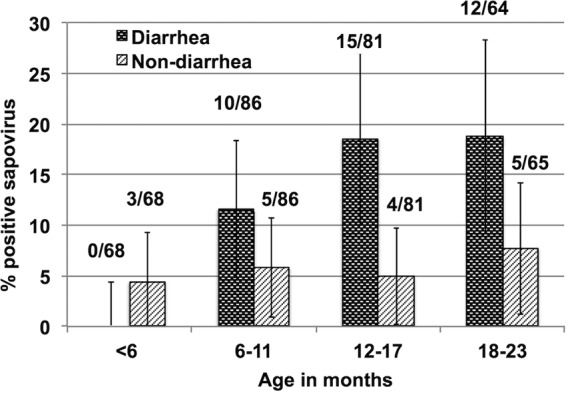
FIG 1.

Prevalence of sapovirus in diarrheal and nondiarrheal stool samples by age in the case-control study in Peru. The y axis indicates the percentage of stools in which sapovirus was detected. The x axis shows age groups of infants. The black bars and gray bars indicate diarrheal and nondiarrheal stools, respectively. Error bars represent 95% confidence intervals. One diarrheal sample was not available in the age group of 18 to 23 months.
