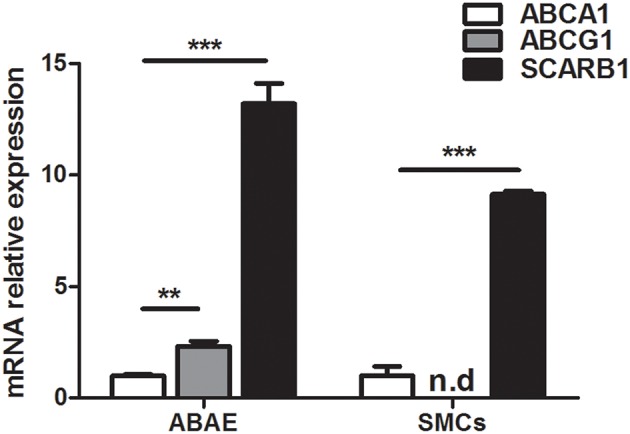
Figure 1.

mRNA expression of ABCA1, ABCG1, and SCARB1 in ABAE and SMCs by real time RT-PCR. Each bar represents the absolute quantification of the three studied gene. Used primers are listed in Table 1. ABCA1 expression level is used as the reference level and set to 1. ABCG1 expression was not detected in SMCs. Results correspond to the mean ± SD of three different experiments pooled from three wells. n.d: not detected. One-way ANOVA test followed by Bonferroni correction was performed in which ***p < 0.001; **p < 0.01 when compared with the ABCA1 expression.
