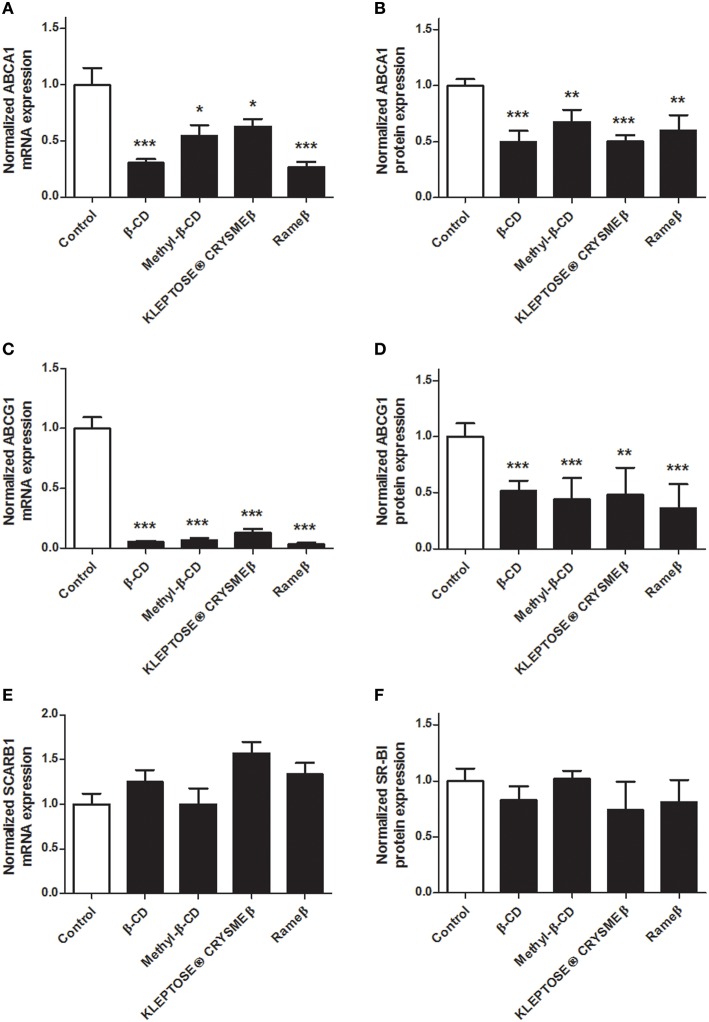
Figure 4.
Evaluation of the expressions of ABCA1, ABCG1, and SR-BI upon CD-treatment in ABAE. Twenty-four hours after treatment (CDs 1 mM, solid bars), mRNA expressions of ABCA1 (A), ABCG1 (C) as well as of SCARB1 (E) were assessed and compared with control (DMEM treatment, open bar). Each bar represents the mRNA expression normalized against the housekeeping gene β-ACTIN ± SEM (n = 6). Control condition (without CD treatment) is used as the reference level and set to 1. A one-way ANOVA test followed by Dunnett's test for multiple comparisons was applied with *p < 0.05; **p < 0.01; ***p < 0.001 compared with control. Normalized protein expression levels for ABCA1 (B), ABCG1 (D), and SR-BI (F) were assessed by immunoblotting. β-ACTIN was used as the loading control. Results correspond to the optical density measured in three experiments. Control condition (without any CD treatment) is used as the reference level and set to 1.

