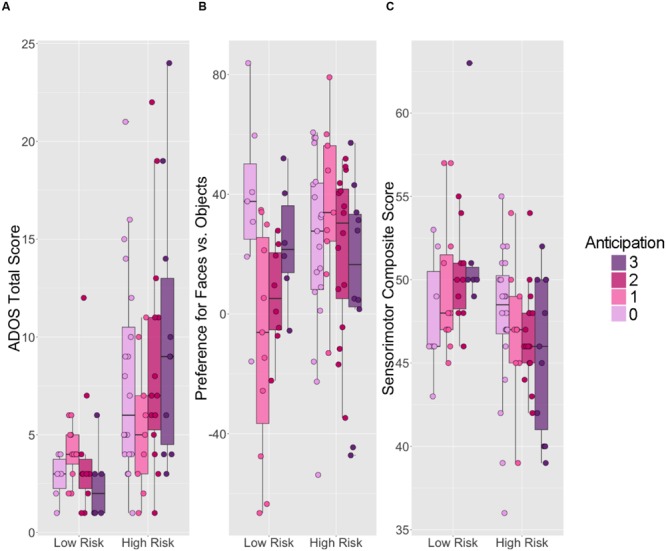
FIGURE 3.

Six-month anticipation behavior versus 14-month social and sensorimotor outcomes for children at low and high familial risk for autism. Boxplots displaying (A) ADOS Total Score, (B) preference for faces compared to objects, and (C) MSEL sensorimotor composite scores. Within each panel, scores for LR children are on the left; scores for HR children are on the right. The upper and lower “hinges” correspond to the first and third quartiles of the distribution for each risk group at each level of 6-month anticipation. Higher ADOS Total scores represent worse performance. Face preference values range from -100 to 100, with negative values indicating a visual preference for objects, 0 indicating no preference, and positive values indicating a visual preference for faces. Sensorimotor composite scores were calculated by summing three relevant age-equivalent subscale scores from the Mullen Scales of Early Learning (MSEL): Visual Reception, Gross and Fine Motor. Higher sensorimotor composite scores represent better performance.
