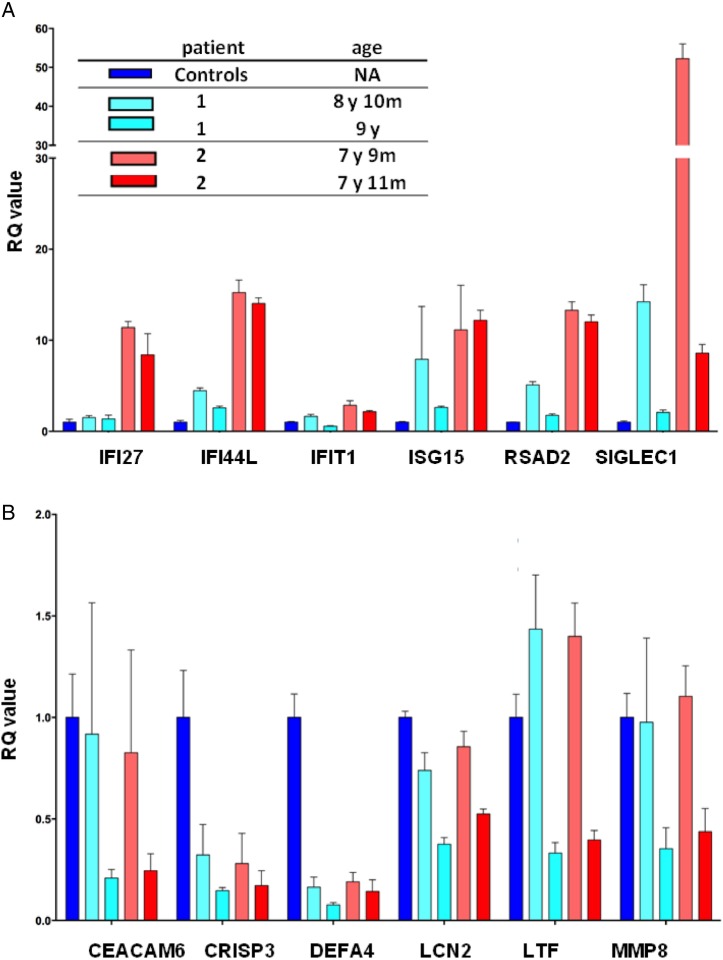
Figure 3.
IFN and neutrophil gene expression studies. The RQ value for each transcript is equal to the normalised fold change relative to a control. (A) Quantitative reverse transcription PCR of a panel of six IFN-1-stimulated genes in CECR1 mutation-positive sisters on two occasions. IFN score was 4.82 before treatment and 1.86 after treatment in patient 1 and 11.79 and 9.47 before treatment in patient 2. IFN-stimulated genes are variably overexpressed in the two patients. (B) The expression of a panel of neutrophil-stimulated genes was measured in patients 1 and 2 on two occasions. Neutrophil-stimulated gene expression was essentially similar to that in controls. IFN-1, interferon 1; NA, not applicable; RQ value, relative quantification value.

