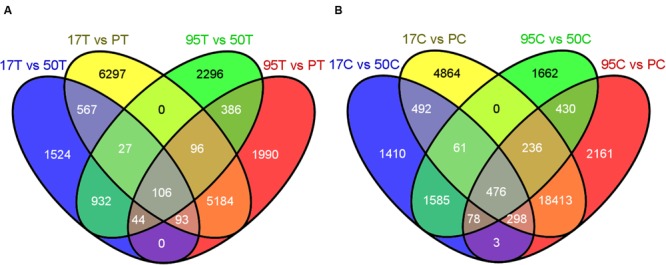
FIGURE 3.

(A) Number of differentially down-regulated (DDR) transcripts in inoculated resistant lines (17T and 95T) compared to the inoculated susceptible lines (PT and 50T). (B) Number of DDR transcripts in uninoculated resistant lines (17C and 95C) compared to the uninoculated susceptible lines (PC and 50C). 17, 50, 95 and P refer to NE BG 7-3459-17, NE BG 7-3453-50, 95–55 and Prestige, respectively. C and T indicate untreated and treated samples, respectively. The Venn diagrams were generated by the Venny tool (http://bioinfogp.cnb.csic.es/tools/venny/) using the DDR transcripts resulting from DESeq2 by comparing each resistant and susceptible line.
