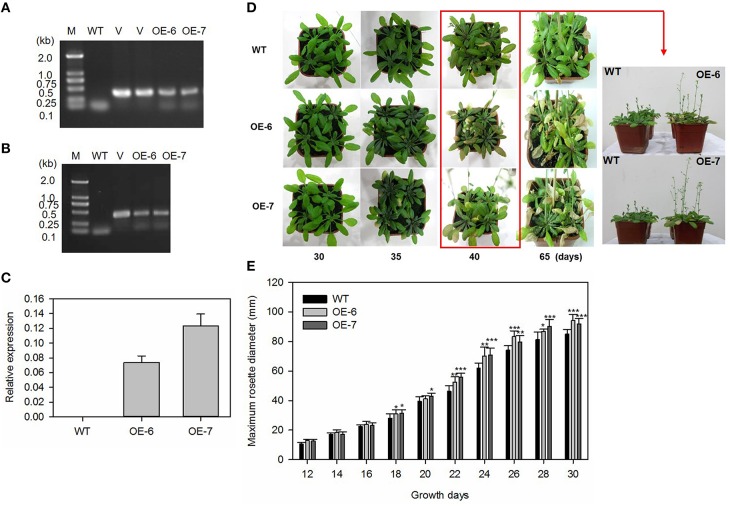
Figure 6.
Heterologous expression of MdATG8i in Arabidopsis and growth phenotype. (A) PCR with gDNA; (B) PCR with cDNA; Lanes M, molecular marker DL2000; V, positive vector containing pGWB406-MdATG8i plasmid; WT, non-transformed wild-type; OE-6 and -7, MdATG8i-transgenic lines; (C) qRT-PCR analysis of MdATG8i transcripts in Arabidopsis lines OE-6 and OE-7; (D) Growth phenotype comparison of WT and transgenic lines under LD photoperiod; (E) Growth for rosettes from WT or transgenic lines under SD photoperiod; Data are means ± SD of 20 replicates. *, ** or *** indicates the statistically significant differences determined by Student's t-tests at P < 0.05, P < 0.01, or P < 0.001, respectively.

