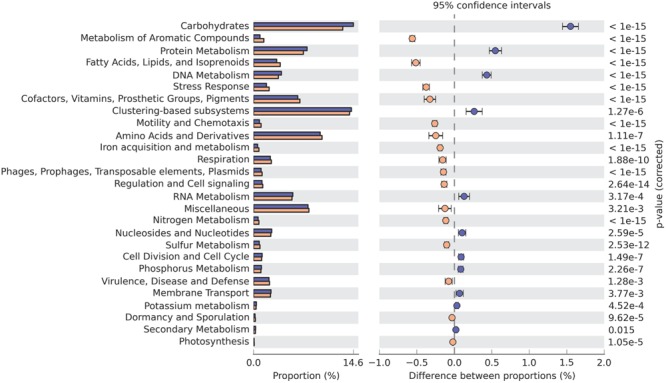
FIGURE 2.

SEED subsystems (level 1) with significantly different abundances in the GZ (blue) and SWH (yellow) metagenomes. Significance was determined by Fisher’s exact test with Storey’s FDR correction for multiple comparisons, with corrected p < 0.05 considered significant.
