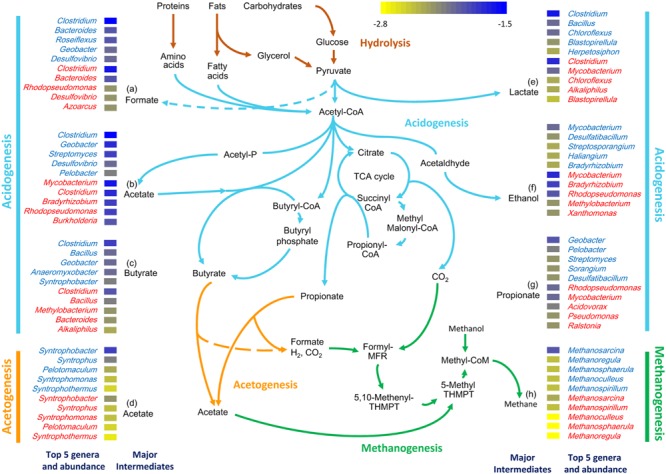
FIGURE 3.

Genera in the GZ (genus name in blue) and SWH (genus name in red) metagenomes mapped to each major AD step (acidogenesis, acetogenesis, and methanogenesis). The five most abundant genera mapped to the last step in the formation of the major intermediates are shown (labeled with a letter). The log10-normalized relative abundance of each genus is indicated by the colored tile beside its name.
