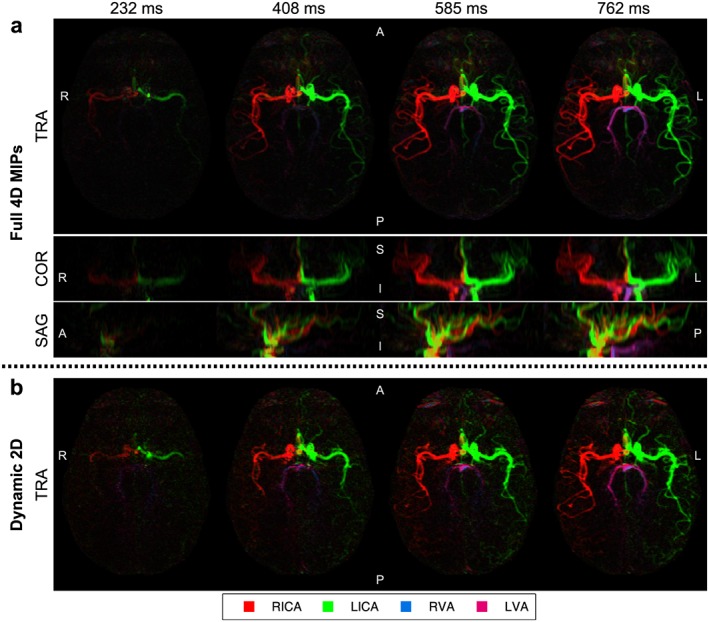
Figure 6.

Selected frames from bSSFP VEPCASL dynamic angiography data in a single subject with inflow‐subtraction: the full 4D data (a) are shown using MIPs in transverse (TRA), coronal (COR) and sagittal (SAG) orientations. Transverse dynamic 2D data acquired in the same imaging slab are also shown (b). Color corresponds to the arterial origin of the blood signal (see legend). Note that overlap of the RICA and LICA signals in the sagittal MIP presents as a yellow hue. The times shown are relative to the end of the VEPCASL pulse train. Orientation is marked on each image (A, anterior; P, posterior; R, right; L, left; S, superior; I, inferior).
