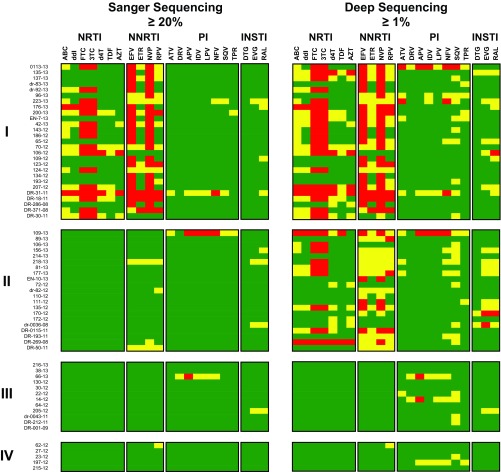
FIG 4.
HIV-1 genotypic resistance interpretation based on Sanger or deep sequencing. A list of all the amino acid substitutions was used with the HIVdb Program Genotypic Resistance Interpretation Algorithm from the Stanford University HIV Drug Resistance Database (http://hivdb.stanford.edu) to infer the levels of susceptibility to protease, reverse transcriptase, and integrase inhibitors. High-level and intermediate resistance profiles are indicated in red and yellow, respectively, while a susceptible genotype is depicted in green. All 65 HIV-infected individuals classified in groups I, II, III, and IV, as described in Table 1, are indicated. NRTIs (ABC, ddI, FTC, 3TC, stavudine [d4T], TDF, and AZT), NNRTIs (EFV, ETR, NVP, and RPV), PIs (atazanavir [ATV], darunavir [DRV], amprenavir [APV], indinavir [IDV], lopinavir [LPV], nelfinavir [NFV], saquinavir [SQV], and tipranavir [TPV]), and INSTIs (dolutegravir [DTG], elvitegravir [EVG], and raltegravir [RAL]) are shown.

