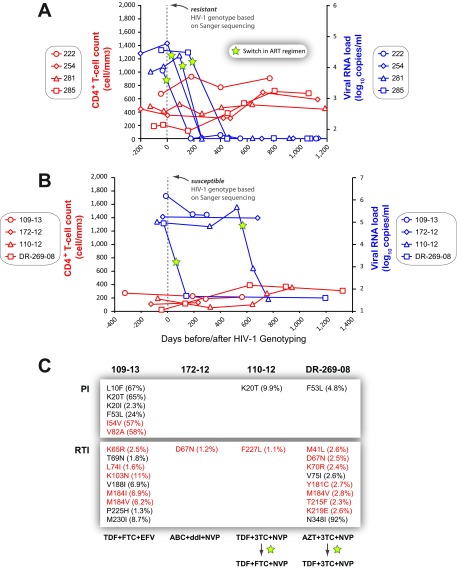
FIG 8.
(A and B) Specific treatment outcomes in patients who switched (A) or remained on current (B) antiretroviral treatment regimens following the identification of drug resistance (A) or a drug-susceptible genotype (B) after a Sanger sequencing-based HIV-1-genotyping test. Viral-RNA levels (copies per milliliter of plasma) and CD4+ T-cell counts (cells per cubic millimeter of blood) were monitored over a 1,000- to 1,200-day period following a drug resistance test. (C) Frequencies of all amino acid substitutions (mutations) associated with resistance to PIs or RTIs detected at ≥1% using DeepGen. Primary (red) and secondary/compensatory (black) drug resistance mutations, defined by the Stanford University HIV Drug Resistance Database (http://hivdb.stanford.edu), are indicated. cART regimens for each patient are included.

