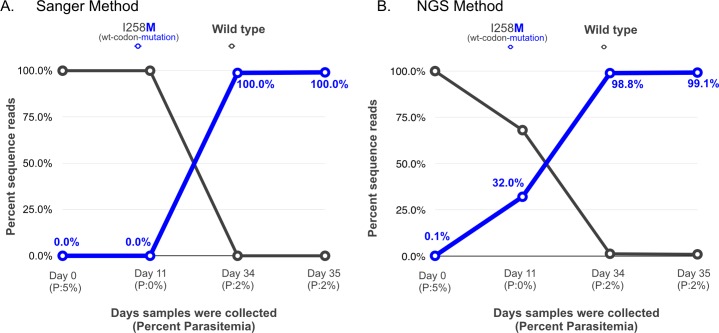
FIG 1.
Comparison of results between (A) Sanger sequencing and (B) next-generation sequencing of D0, D11, D34, and D35 patient samples. Percentage parasitemia is shown below each day (P:n%). Percentage sequence reads contributing to the specific atovaquone-proguanil resistance-associated loci in cytochrome b are shown on the y axis, and pretreatment (D0) and day of treatment failure samples (D11 to D35) are shown on the x axis.

