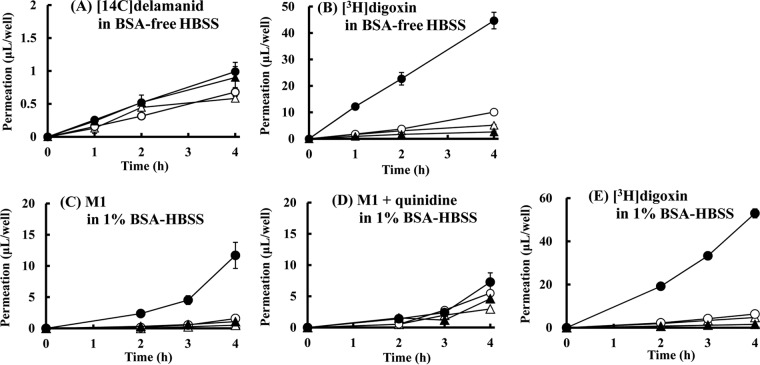
FIG 2.
Time profiles for the transcellular transport of [14C]delamanid and metabolite M1 across control LLC-PK1 cells (open symbols) and MDR1-expressing LLC-PK1 cells (closed symbols). The experiment was started by the addition of the following substrate to one compartment: [14C]delamanid (5 μmol/liter) in BSA-free HBSS (A), [3H]digoxin (1 μmol/liter) in BSA-free HBSS (B), M1 (3 μmol/liter) in 1% BSA-HBSS (C), M1 (3 μmol/liter) plus quinidine (30 μmol/liter) in 1% BSA-HBSS (D), or [3H]digoxin (1 μmol/liter) in 1% BSA-HBSS (E). The inhibitor quinidine was added in both the apical and basal compartments. Circles, basal side-to-apical side flux; triangles, apical side-to-basal side flux. Data are expressed as the mean ± SD from triplicate determinations.

