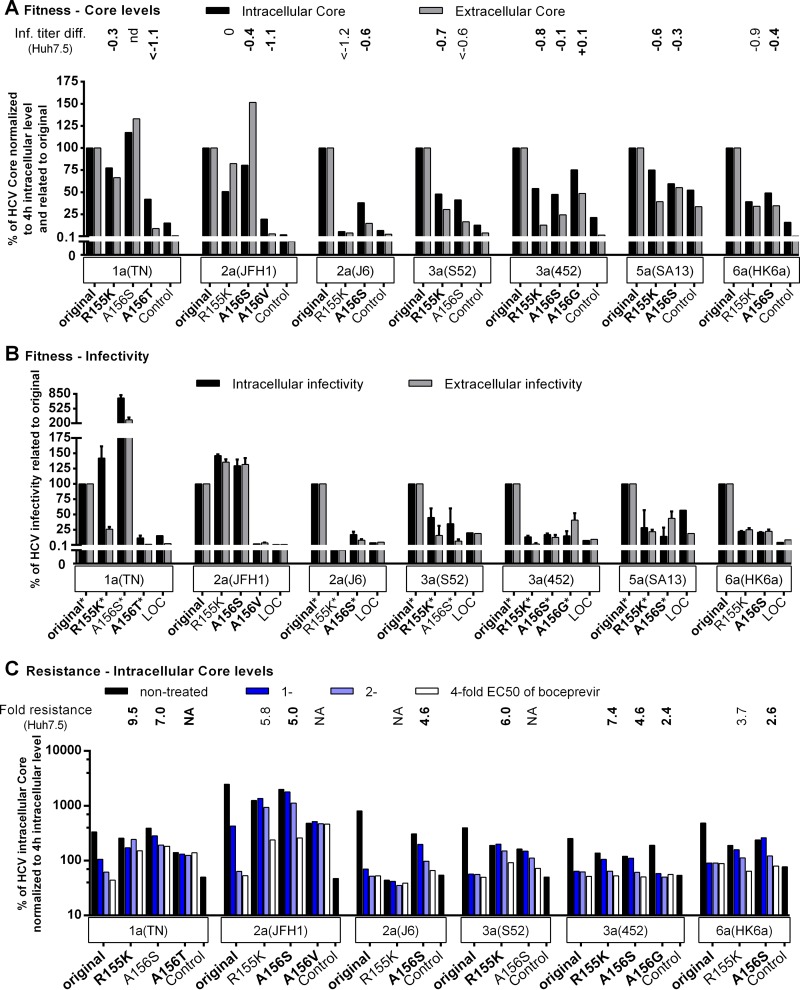
FIG 5.
Fitness impairment and PI resistance associated with key resistance substitutions at NS3P positions 155 and 156 affected viral replication across genotypes. RNA transcripts from the indicated genotype 1a (isolate TN), 2a (isolates JFH1 and J6), 3a (isolates S52 and 452), 5a (isolate SA13), and 6a (isolate HK6a) HCV recombinants were transfected into S29 cells. (A and B) For nontreated replicates, IC and EC core concentrations (A) and infectivity titers (B) were determined as described in Materials and Methods. (C) For the replicates treated 4 h posttransfection with boceprevir at the indicated multiple of the EC50, only the IC core concentration is shown. The corresponding IC and EC infectivity titers and the EC core concentration obtained under treatment are shown in Fig. S4 in the supplemental material. The low levels of replication of genotype 4a (isolate ED43) and genotype 5a (isolate SA13) recombinants in S29 cells have prevented or limited their use in this assay. To account for possible differences in transfection efficiency, IC and EC core concentrations at 48 h were normalized to IC core concentrations at 4 h (A and C). To determine the effects of the indicated NS3P substitutions on viral fitness, the normalized core values (A) and infectivity titers (B) of variant recombinants were related to the values for the respective original recombinants (original). In panels A and C, “Control” indicates the replication-deficient genotype 2a (isolate JFH1) negative-control virus with the mutation of the NS5B RNA polymerase active site (GlyAspAsp to GlyAsnAsp [GND]) (20), which was included in each transfection experiment. For this control, IC core concentrations at 48 h ranged from 9.4 × 10³ to 25.0 × 10³ fmol/liter, and EC core concentrations at 48 h ranged from 17.5 to 131.8 fmol/liter. The values shown for the control were normalized to the IC core concentrations at 4 h. In panel A, the values were also related to those obtained for the respective original recombinants (original) as was described for the NS3P variants. Transfections of recombinants of the same genotype (isolate) shown in the same graph were carried out in the same experiment; each of these experiments included the genotype 2a (isolate JFH1) GND negative-control virus. In panel B, LOC indicates the lower cutoff of the infectivity titration assay. For automated counting of FFU, the LOCs for IC and EC infectivity titers were 1.5 log10 FFU/well and 2.3 log10 FFU/ml, respectively. In instances where low replication efficiency in S29 cells precluded automated counting, FFU were counted manually, and the resulting titers are indicated by asterisks. The LOC for infectivity titers derived from manually counted FFUs was 0.9 log10 FFU/well for IC titers and 1.6 log10 FFU/ml for EC titers. LOC values were related to the values obtained for the respective original recombinants (original) as described for NS3P variants. The NS3P substitutions in boldface were specifically selected in the indicated virus under PI treatment in this study (Fig. 1 and 2). For comparison, the difference in the infectivity titer (Inf. titer diff.) observed following transfection of Huh7.5 cells (A) or the fold resistance to boceprevir (C) is indicated above each variant. Differences in infectivity titers and fold resistance were calculated as described in Materials and Methods. Values determined in this study (Fig. 3 and 4) are indicated in boldface; other values either were reported previously (28) or were calculated on the basis of infectivity titers determined in reference 28. The infectivity titer of genotype 1a (isolate TN) A156S was not determined, preventing calculation of the titer difference in Huh7.5 cells (nd, not determined). Instances in which fold resistance values could not be determined because the specified recombinant could not be grown in Huh7.5 cells (Fig. 3) (28) are indicated by NA (not applicable).

