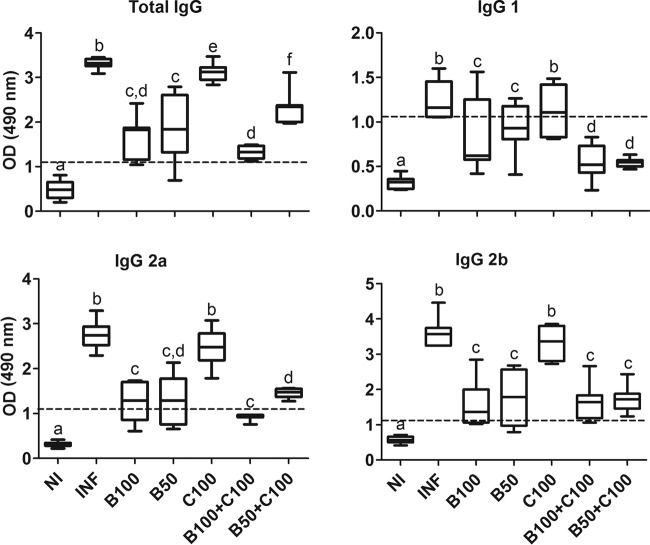
FIG 4.
Plasma reactivity of anti-T. cruzi IgG in mice infected with T. cruzi and treated with benznidazole and curcumin. The treated animals received benznidazole (100 or 50 mg/kg) and curcumin (100 mg/kg). The dashed lines represent the discriminant values of reactivity calculated by dividing the individual absorbance by the cutoff values (mean ± 2 SD) from uninfected blood samples (negative control). The boxes represent the interquartile ranges; the horizontal lines are medians, and the whiskers show the upper and lower quartiles. Different letters above the bars (a to f) indicate statistical differences among the groups (P < 0.05), and groups that have common letters do not differ statistically (P > 0.05).

