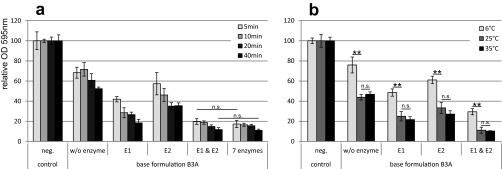
FIG 2.
Biofilm removal under different conditions. P. aeruginosa biofilm was treated for different time periods at 25°C (a) or at different temperatures for 40 min (b) with base formulation B3A containing no, one, or two enzymes. The y axis represents the biofilm amount quantified by crystal violet staining relative to the negative control. Error bars represent results from 6 individual replicates. Enzyme E1 represents a polysaccharidase, and enzyme E2 is a protease. A t test was applied to calculate statistical significance (not significant [n.s.; P > 0.05] or highly significant [**, P < 0.001]) for comparisons, as indicated by lines in the graph.

