Figure 1.

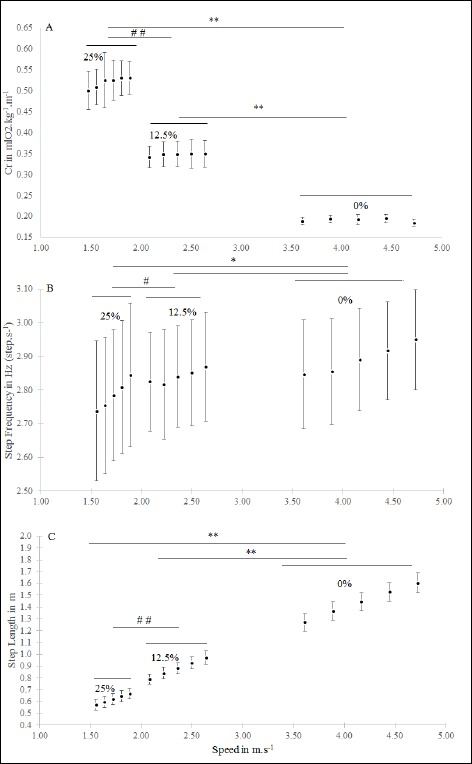
A. Energy cost of running (Cr, mlO2 .kg-1.m-1) measured at five velocities at the Ventilatory Threshold at the three conditions of slope. Significant differences, p < 0.01, have been observed between 0, 12.5 and 25%. There was a speed effect only at 25%, p < 0.05 and no differences observed between the five speeds at 0 and 12.5%. B. Step Frequency (SF, Hz, step.s-1) measured at five velocities at the Ventilatory Threshold at three conditions of slope. SF increased with speed at 0 and 25% grade and SF at 25% was significantly lower than that observed at 12.5% and 0%, p < 0.05. C. Step length (SL, m) measured at five velocities at the Ventilatory Threshold at the three conditions of slope. (SL significantly increased with speed in each condition and SL at 25% was significantly lower compared to SL at 12.5% (p < 0.01) and SL at 0% (p < 0.01) in the same way, SL at 12.5% was significantly lower than SL at 0% (p < 0.05)). Energy Cost of Running, Step Frequency and Step Length measured at five velocities at the Ventilatory Threshold under the three slopes conditions.
