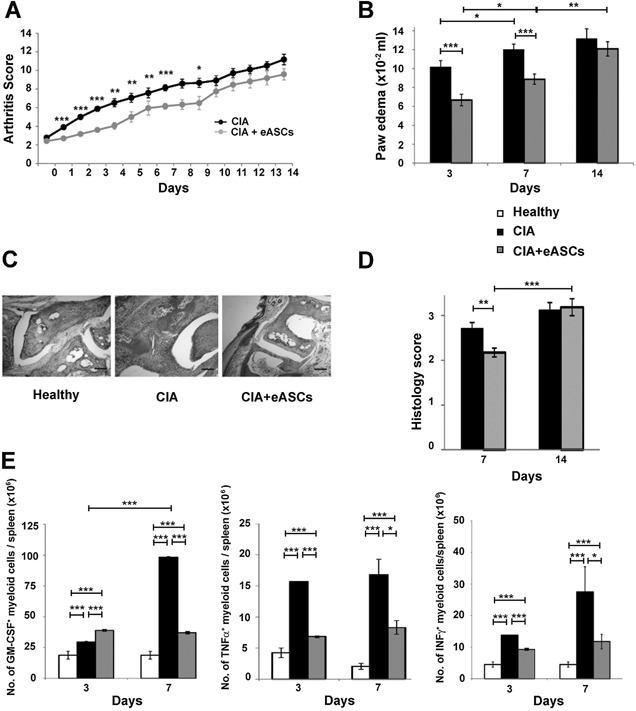
Figure 1.

Arthritis status of mice measured by arthritis score, paw edema, histology, and number of inflammatory myeloid cells. Arthritis score (A), based on the number of swollen paws (front and hind), was evaluated daily for 14 days in the CIA (n = 49) and eASC‐treated CIA (n = 67) mice. (B) Paw edema is measured at day 3, 7, and 14 by a plethysmometer in CIA (n = 34) and eASC‐treated CIA (n = 52) mice. (C) Representative sections showing examples of paw swelling in healthy, CIA, and eASC‐treated CIA mice. Scale bars, 200 μm. Original magnification, ×40. (D) Histology score based on synovitis and cell infiltration evaluated at days 7 and 14 in the CIA (n = 12) and eASC‐treated CIA (n = 20) mice. (E) Quantification of GM‐CSF, TNFα, and INFγ inflammatory myeloid cells in spleen by flow cytometry. Cells were activated with PMA and ionomycin for 4 h in the presence of GolgiStop and GolgiPlug. After incubation, cells were harvested and stained on their surface. For intracellular staining, cells were fixed permeabilized and stained. Percentages of GM‐CSF, TNFα, and INFγ inflammatory myeloid cells in the spleen at day 3 and 7 of healthy, CIA, and eASC‐treated CIA mice were shown. Healthy n = 24, CIA n = 25, and eASC‐treated CIA n = 42 for GM‐CSF and TNFα myeloid cells and healthy, n = 24; CIA, n = 13, and eASC‐treated CIA, n = 22 for INFγ myeloid cells. Data are presented as mean and the standard error of the mean of the arthritis score, paw edema, histology score, and number of inflammatory myeloid cells. Significance was analyzed by the Mann–Whitney test and represented by *P < 0.05, **P < 0.01 and ***P < 0.001. Results represent four experiments.
