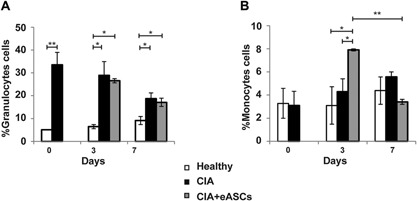
Figure 2.

Hematological analysis of peripheral blood samples. Peripheral blood was analyzed by an automated blood cell‐counter. (A) Percentage of granulocytes cells and (B) percentage of monocytes cells of healthy, CIA, and eASC‐treated CIA mice at day 0, 3, and 7. Data are represented by the mean and the standard error of the mean. *P < 0.05 and **P < 0.01 represent the significance analysed by the Mann‐Whitney test (healthy, n = 9; CIA, n = 14; and eASC‐treated CIA, n = 12). Data correspond to one representative out of four experiments.
