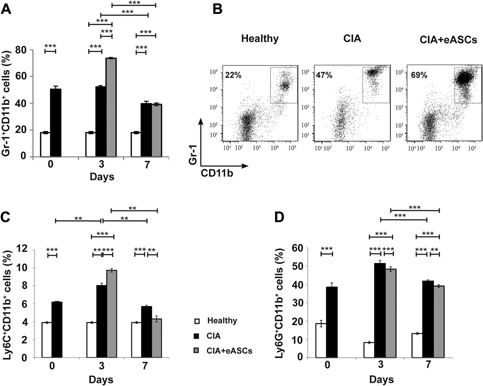
Figure 3.

Quantification of Gr‐1+CD11+, Ly6C+CD11b+, and Ly6G+CD11b+ myeloid cell populations in peripheral blood by flow cytometry. Cells were stained on their surface with anti‐CD11b, anti‐Gr‐1, anti‐Ly6C, and anti‐Ly6G monoclonal antibodies. (A) Percentage of Gr‐1+CD11b+ myeloid cells in peripheral blood at day 0, 3, and 7, (B) representative dot plot of Gr‐1+CD11b+ myeloid cell population in peripheral blood at day 3, (C) percentage of Ly6C+CD11b+ myeloid cells at day 0, 3, and 7 in peripheral blood, and (D) percentage of Ly6G+CD11b+ myeloid cells at day 0, 3, and 7 in peripheral blood of healthy, CIA, and eASC‐treated CIA mice. Data are represented by the mean and the standard error of the mean. **P < 0.01 and ***P < 0.001 represent the significance analyzed by the Mann–Whitney test (healthy, n = 20; CIA, n = 19; and eASC‐treated CIA, n = 23). Results represent four experiments.
