Figure 4.

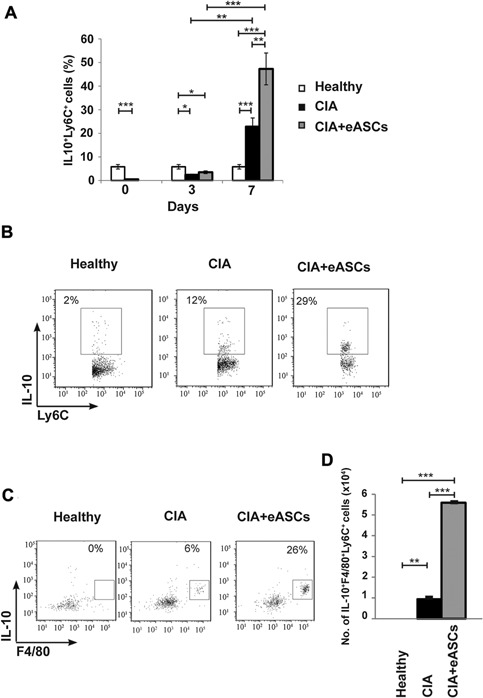
Quantification of IL‐10+Ly6C+ and IL10+F4/80+ within Ly6C+ myeloid cell populations in peripheral blood by flow cytometry. Cells were activated with PMA and ionomycin for 4 h in the presence of GolgiStop and GolgiPlug. After incubation, cells were harvested and stained on their surface with anti‐Ly6C and anti‐F4/80 monoclonal antibodies. For intracellular staining, cells were fixed, permeabilized, and stained with anti‐IL‐10 monoclonal antibody. (A) Percentage of IL‐10+Ly6C+ myeloid cell populations in peripheral blood at day 0, 3, and 7, (B) representative plot of IL‐10+Ly6C+ myeloid cells at day 7 in peripheral blood, (C) representative plot of IL10+F4/80+ myeloid cell within the Ly6C+ myeloid cells at day 7 in peripheral blood, and (D) number of IL‐10+F4/80+Ly6C+ myeloid cells in peripheral blood at day 7 of healthy, CIA, and eASC‐treated CIA mice. Data are represented by the mean and the standard error of the mean. *P < 0.05, **P < 0.01, and ***P < 0.001 represent the significance analyzed by the Mann–Whitney test (healthy, n = 12; CIA, n = 13; and eASC‐treated CIA, n = 14). Results represent four experiments.
