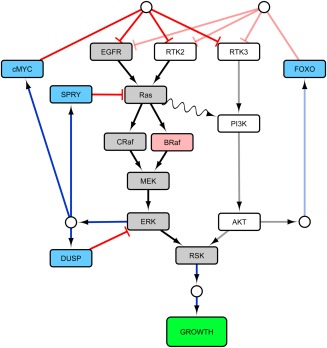
Figure 2.

Signaling pathway diagram generated in Cytoscape software. Visual properties of nodes and edges are user‐specified. Diagrams can be generated for any network directly in GUI or through text/tabular file specification of nodes and connectivity.
