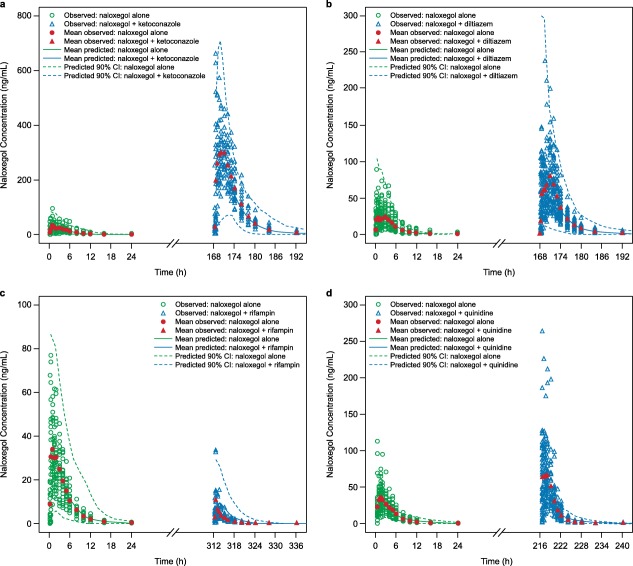
Figure 1.

Simulated plasma drug concentration‐time profiles for 25 mg naloxegol alone and in the presence of the cytochrome P450 (CYP)3A4 modulators (a) ketoconazole 400 mg, minimal physiologically based pharmacokinetic (PBPK) model; (b) diltiazem 240 mg, minimal PBPK model; (c) rifampin 600 mg, minimal PBPK model; and (d) quinidine 600 mg, full PBPK model. Data for naloxegol alone are represented in green, and data for naloxegol in the presence of the respective CYP3A4 modulators are represented in blue. Observed values for naloxegol alone are represented by diamonds, and observed values for naloxegol + CYP3A4 modulators are represented by triangles. Red symbols represent mean observed values. Dashed lines represent the 90% confidence interval of the respective simulations.
