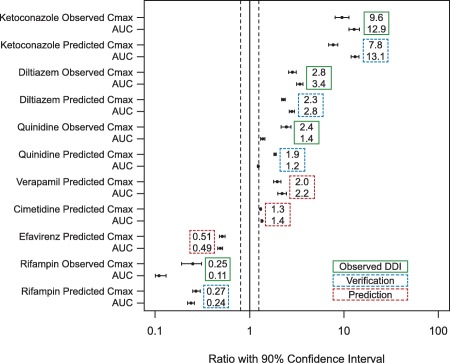
Figure 2.

Simulated and observed naloxegol peak plasma concentration (Cmax) and area under the curve (AUC) ratios when coadministered with weak, moderate, and strong inhibitors and moderate and strong inducers of cytochrome P450 (CYP)3A, with 90% confidence intervals. Dashed lines represent the (80%, 125%) interval. Verification and prediction are both model‐predicted interaction results, but indicate cases in which the actual clinical drug‐drug interaction (DDI) studies were conducted (verification) or were not (prediction).
