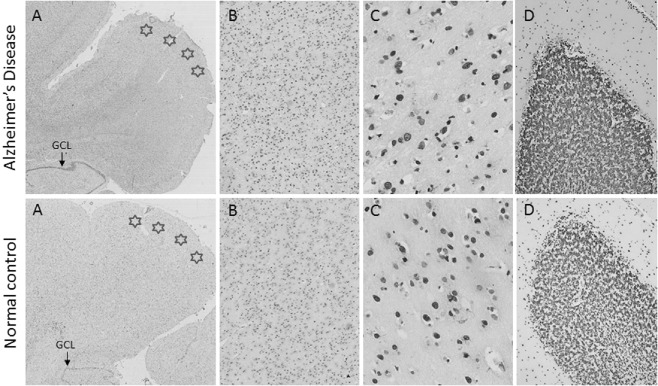
Figure 1.

5‐methylcytosine immunohistochemistry in an AD (case 18) and a normal control (case 1). (A) 5‐methylcytosine immunohistochemistry in the entorhinal cortex (stars) demonstrates the amount of staining seen at three magnifications [×2 (A), ×10 (B) and ×40 (C)]. (D) Staining intensity in AD and control cerebellum (×10). Similar staining patterns were observed between the AD cases and normal controls.
