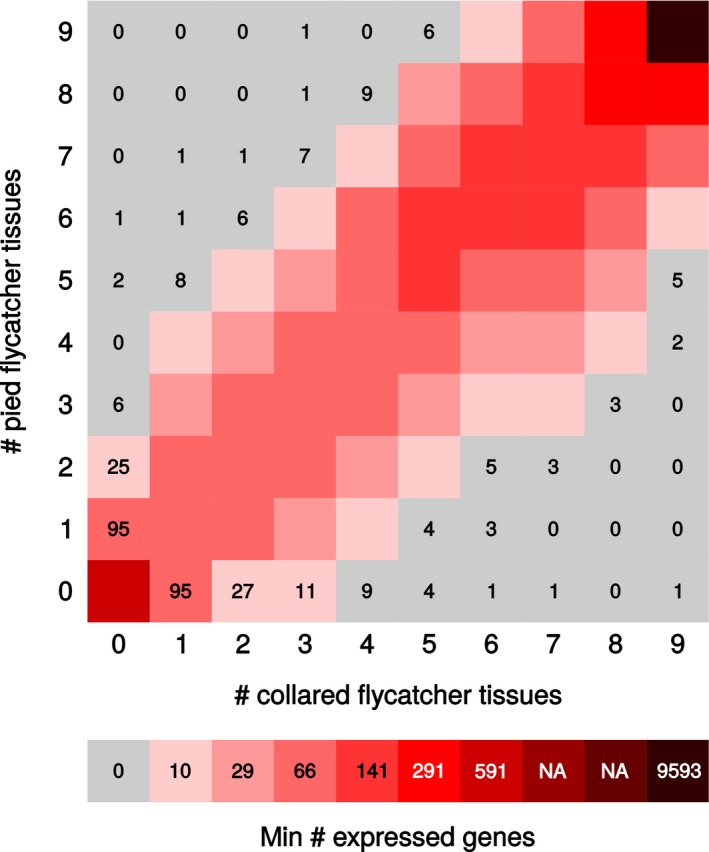
Figure 3.

Heat map showing the number of genes detected as expressed in different tissues in collared and pied flycatcher. A large proportion of all genes (62.9%) are expressed in all tissues of both species. The leftmost column and the bottommost row show genes uniquely expressed in pied and collared flycatcher, respectively, with exact numbers given.
