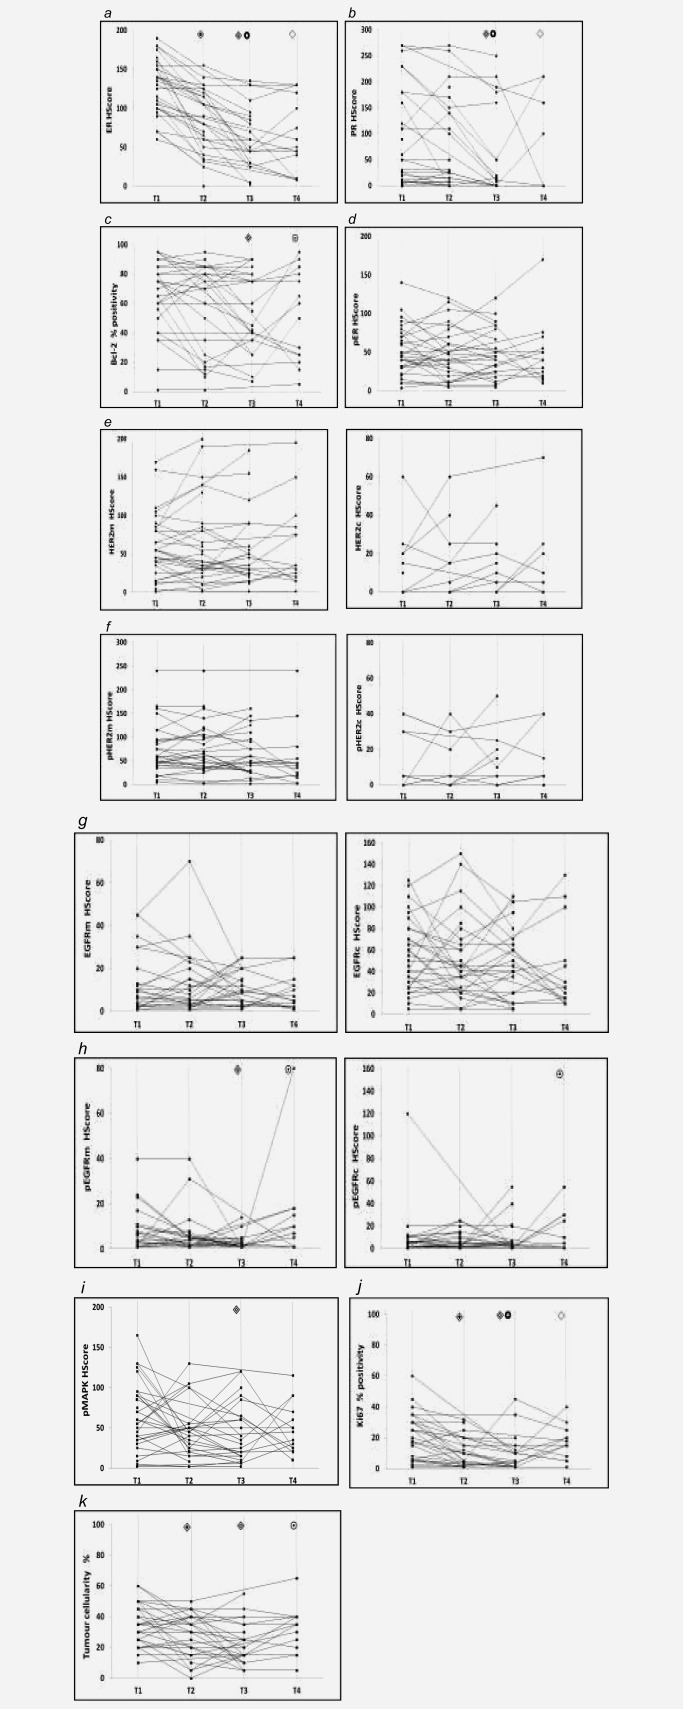
Figure 2.

Line plots of individual changes in markers (matched data) across T1 (pretreatment) and T2, T3 and T4 (6 week, 6 month and at progression on fulvestrant respectively) for each patient. Wilcoxon Paired Signed‐Rank test compared staining between time‐points using paired sample data from each patient. Significance between T1‐T2, T1‐T3, T2‐T3, T1‐T4 or T3‐T4 is indicated by  ,
,  ,
,  ,
,  and
and  , respectively. To aid visualisation of profile over the multiple time‐points in these plots, marker data have been connected in the same patient if any sample was unavailable. (a) ER H Score (T1‐T2, T1‐T3, T2‐T3 falls p < 0.001; T1‐T4 fall p = 0.001); (b) PR H Score (T1‐T3 p < 0.001, T2‐T3 falls p = 0.006; T1‐T4 fall p = 0.012); (c) Bcl‐2% positivity (T1‐T3 fall p = 0.007; T3‐T4 increase p = 0.066); (d) pER (serine 118 phosphorylation) H Score; (e) HER2m (membrane) and HER2c (cytoplasmic) H Scores; (f) pHER2m (membrane) and pHER2c (cytoplasmic) H Scores (NB. no measurable staining was detected in any sample from 20 patients for HER2c and 16 patients for pHER2c); (g) EGFRm (membrane) and EGFRc (cytoplasmic) H Scores; (h) pEGFRm (membrane; T1‐T3 fall p = 0.024; T3‐T4 increase p = 0.012) and pEGFRc H Scores (cytoplasmic; T3‐T4 increase p = 0.041); (i) pMAPK H Score (T1‐T3 fall p = 0.019); (j) Ki67% positivity (T1‐T2 p = 0.001, T1‐T3 p = 0.012, T2‐T3 falls p = 0.048; T1‐T4 fall p = 0.028); (k) Tumour cellularity % (T1‐T2 fall p = 0.019; T1‐T3 fall p = 0.003; T3‐T4 increase p = 0.065).
