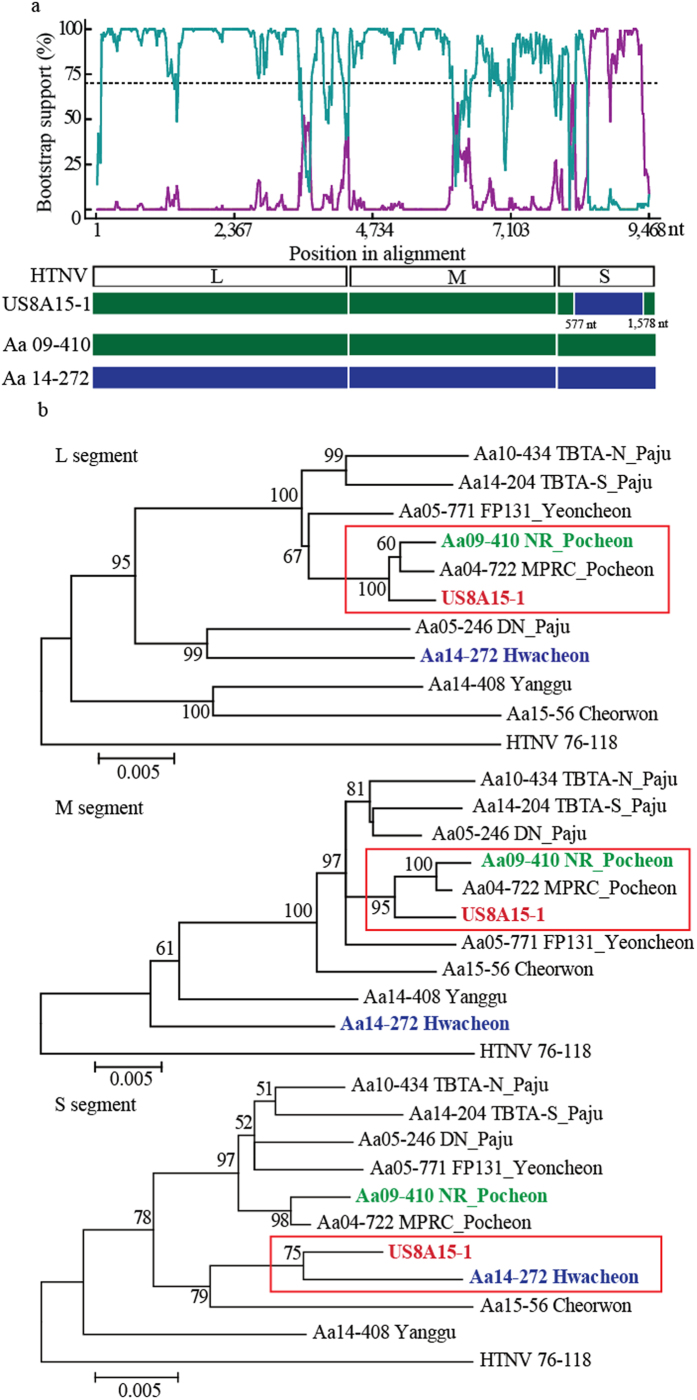
Figure 3. Recombination analysis of US8A15-1 from a HFRS patient.
(a) The Bootscan plot was based on a pairwise distance model by the RDP4 algorithm. A Bootscan Support Percent of over 70% (cutoff value) was considered significant. Green color represents the comparison of HTNV from US8A15-1 to that from Pocheon. Violet color represents the comparison of HTNV from US8A15-1 to that from Hwacheon. Green bars represent the genome structure of Aa09-410 from Pocheon. Violet bars represent the genome structure of Aa14-272 from Hwacheon. (b) The HTNV recombination identified in Gangwon and Gyeonggi provinces was analyzed phylogenetically by the construction of individual ML trees for the L, M, and S segments. Bold red, green, and violet color indicate HTNV US8A15-1, HTNV stains from Pocheon, and Hwacheon, respectively.

