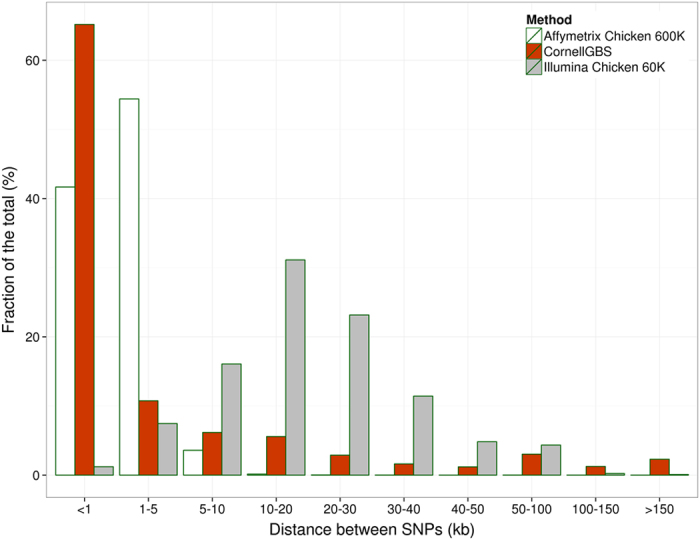
Figure 4. Distribution of distance ranges between SNPs.

SNPs were mapped against chromosome locations of the chicken genome after being detected with Affymetrix 600K, CornellGBS or Illumina Chicken 60K Beadchip. The x-axis represents the distances between adjacent SNPs (Kb) and the y-axis represents the fraction of the total SNPs called.
