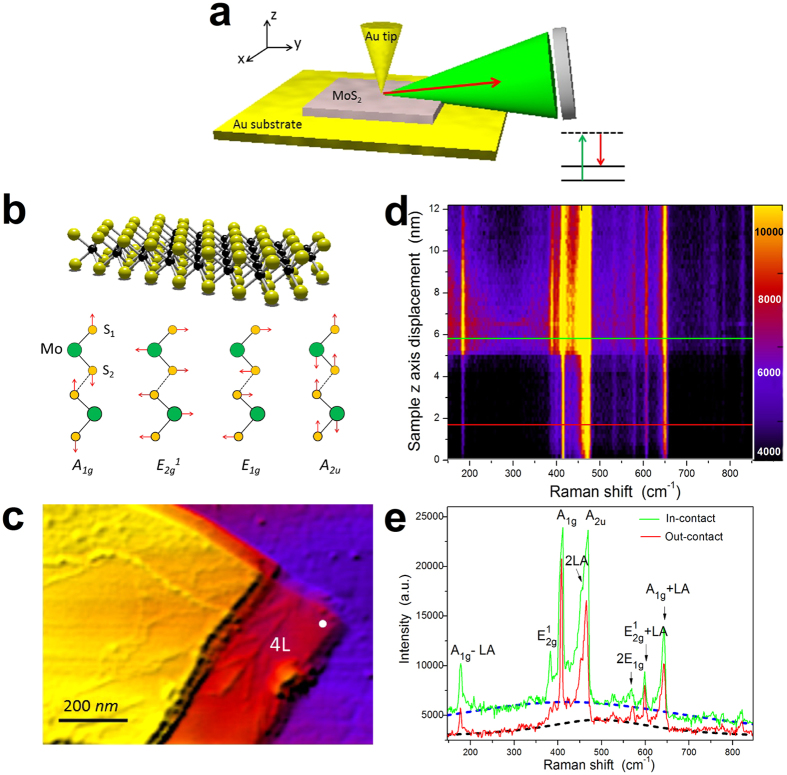
Figure 1. Resonant tip-enhanced Raman scattering (TERS) of FL-MoS2.
(a) Schematic of the experimental setup: 660 nm laser (green cone) is focused on the gold tip in contact with the FL-MoS2 flake on the gold substrate. The emitted light (red arrow) is detected in the backscattering geometry. Inset shows the Raman process. (b) Structure of the monolayer MoS2 and four observed vibrational modes of the FL-MoS2. (c) AFM image of the FL-MoS2 flake. White dot marks the location from which the tip-enhanced optical signals in (d) and (e) were obtained. (d) Sample z-axis displacement-dependence of the optical signal from the location marked by the white dot in (c). (e) Optical spectra for the tip-sample distance of 5.8 nm (red line, out-of-contact) and 0.33 nm (green line, in-contact) which correspond to the red and green lines in (d) respectively. Dashed lines show the fittings of the photoluminescence background signals. The observed Raman transitions are labeled in (e) according to the vibrational modes shown in (b).

