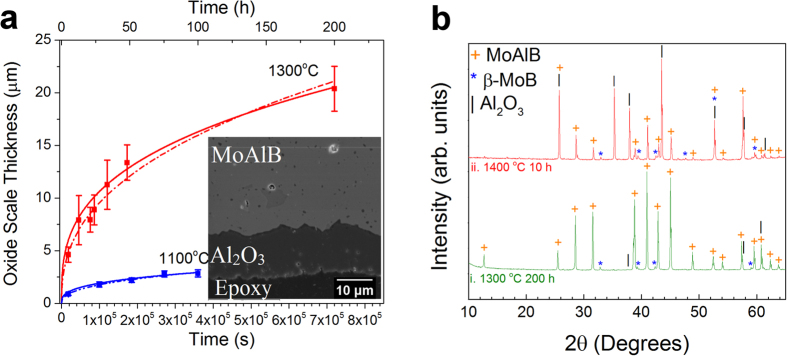
Figure 7.
(a) Time dependence of the oxide scale thickness from isothermal oxidation testing at 1300 °C (red) and 1100 °C (blue). Solid curves show fits to a cubic law; dashed curves show fits to a power law (see text). Inset show MoAlB/oxide scale interface after 200 h at 1300 °C; (b) XRD after oxidation at (i) 1300 °C for 200 h and, (ii) 1400 °C for 10 h.

